 Image 1 of


Pie
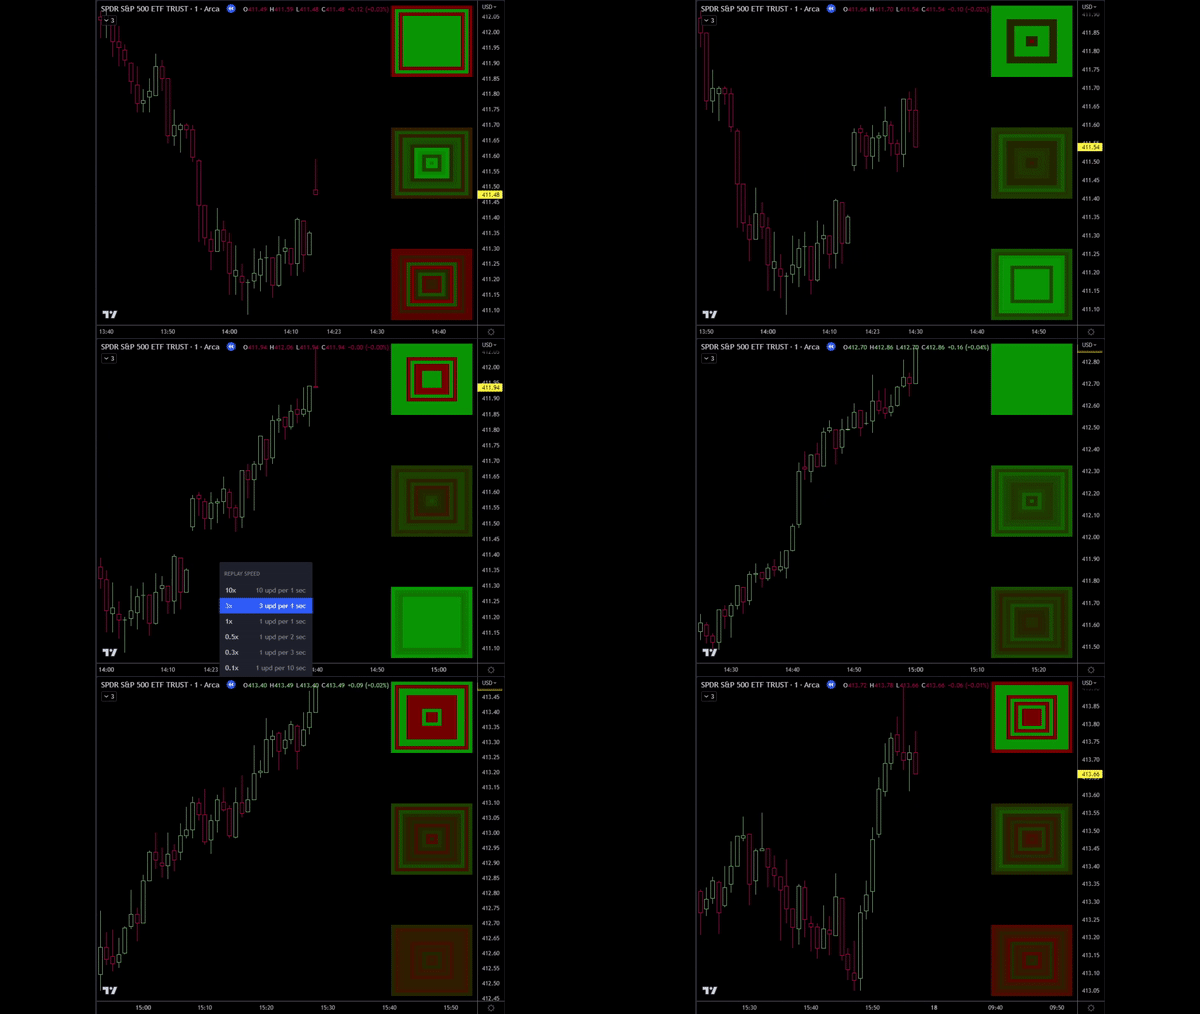
Upgrade your market analysis and take your market internals vision to a new level by immediately seeing what the S&P subsectors are doing in a beautiful and compact pie.
By default, the Pie uses the 11 S&P subsectors, but you can use any symbols. You’re the chef.
The outer ring represents the most heavily weighted subsector and thus takes up the most screen space. Inner rings represent smaller segments, with the least weighted segment in the middle. The Pie was made with the belief that screen space should be represented by the most influencial factors.
Combine any of the plot types with any of the indicators below!
See when heavily weighted sectors are leading or lagging
Pie plots the current state of the S&P subsectors via
Price
Indicator value
Indicator slope
Divergence
Supports the following indicators with fully customizable inputs
Moving Average (MA)
Exponential Moving Average (EMA)
Relative Strength Index (RSI)
Money Flow Index (MFI)
Moving Average Convergence Divergence (MACD)
Average True Range (ATR)
Moving Average Cross (MA Cross)
Exponential Moving Average Cross (EMA Cross)
Stochastic %K and %D (Stoch)
Choose any symbols of your choice to make custom pies
Customize the colours, locations and size of your pies
