AutoAD Examples, Tips and Suggestions
Contents
Brief Introduction to Algorithmic Trading
Example Preconditions
Example Strategies
Simple Trend Follower
Current Chart Trend Follower
Current Chart Trend Follower with Stop Loss
S&P and Current Chart Roller
S&P, Volatility & Internals
The American Lunchtime Permabear
NDX VWAP Scalper
Crypto Mean Reverting Scalper
Rolling Trend Follower with ATR Trailing Stop Loss
S&P and Volatility Divergence
Brief Introduction to Algorithmic Trading
AutoAD is a tool for building automated trading strategies in TradingView. If you’re familiar with algo trading, please excuse all the disclaimers. If you are new to the world of quantitative trading, it is recommended that you do some research before designing your strategy. These are a few things we recommend understanding before running an automated trading strategy:
Back testing (in-sample data) & forward testing (out-of-sample data)
Optimization, overfitting, survivorship bias, drawdowns and compounding in backtests
Broker commissions, slippage, and their relationship with your account/position size
For those who want to dig deeper, Quantopian video lectures and the algotrading subreddit are good places to start.
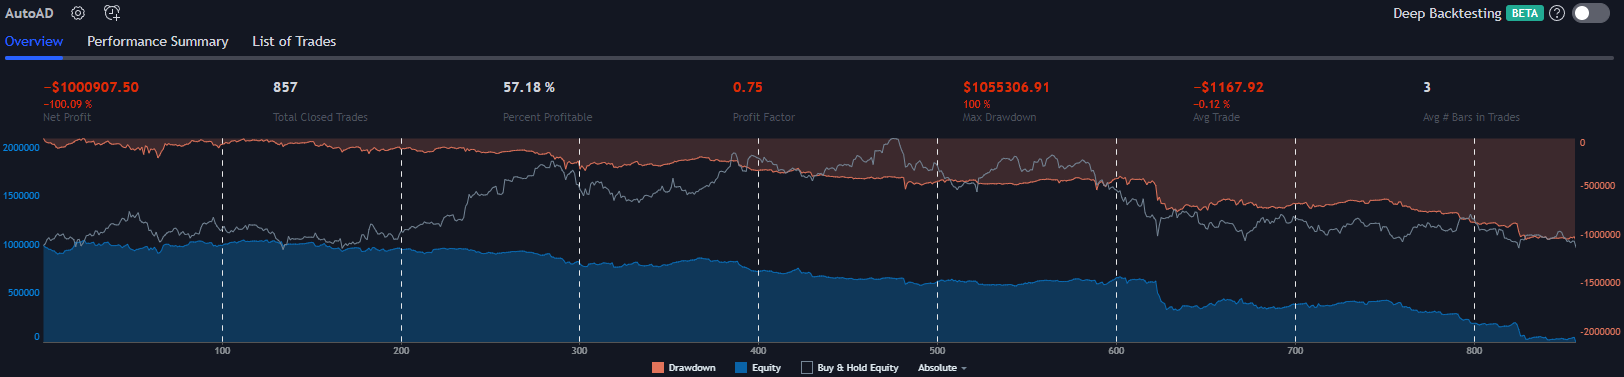
Below are some examples of ways you could use AutoAD. But first, here is an example backtest guilty of overfitting, survivorship bias, and compounding… So you don’t have to:
Example Preconditions
All results on this page are using the default strategy conditions which come with AutoAD. Those conditions are:
All settings and trade conditions refer to long trades. Short trades are reversed. More details about this are in the user guide.
$1,000,000 starting account balance.
Every trade uses $1,000,000. It will never be more or less than this until the account balance reaches 0. Using a flat nominal number gives reliable results and is more easily understood when looking at the profit factor and average trade percent statistics. This is to avoid compounding and unrealistic results. It’s okay to use a percentage of your account size so long as the percent used is low. What “low” means will depend on the volatility of the symbol you’re trading.
No pyramiding.
Commissions and slippage are both set to 0. In reality, commissions and slippage will negatively affect every strategy you ever run. They make high frequency trading impossible for retail traders and can cause an otherwise great strategy to fail miserably if not considered. They are both disabled here because slippage and commissions are impacted by many variables, such as the trader’s position sizing, the brokerage commission fees and, the bid/ask spread of the symbol being traded etc. The more trades you make, the more these factors will kill your strategy. The example strategies here will aim to minimize the total number of trades where possible to be more suitable for smaller position sizes.
All settings are set to their defaults unless otherwise specified. The settings menu is large and it would waste screen space to share all of the unused settings for each example, so the images of the settings have been cropped so that you only see the important stuff.
You have read and understand the user guide to the best of your ability. Otherwise, have it at the ready so that the core functionality need not be explained twice.
Technimentals strongly recommends that you understand why this result is unrealistic before using any automated trading strategy with real money.
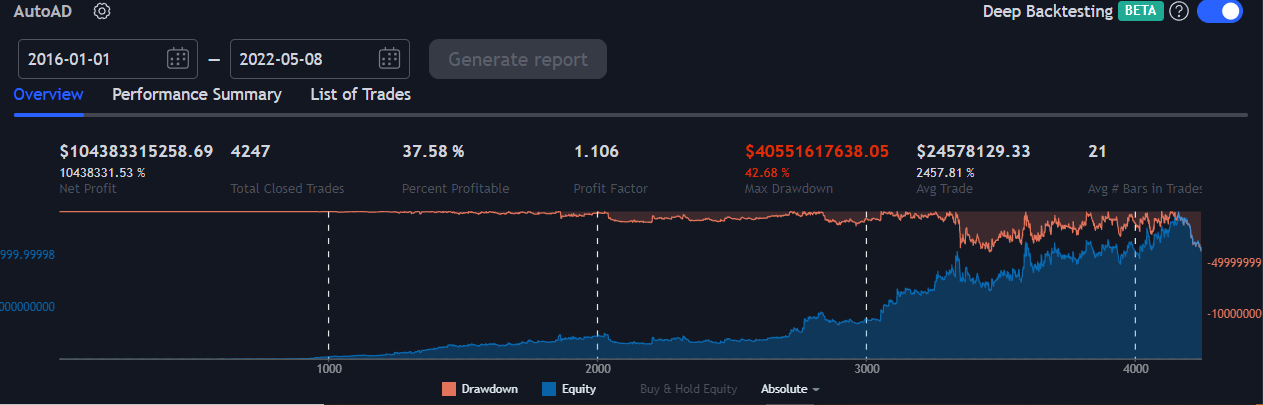
AutoAD has been designed to make trading decisions based upon the performance of user defined groups of symbols with different user defined weights. The weights used will often be based upon data which is constantly changing and must be kept up to date, for example when using the 11 subsectors of the S&P. When backtesting, the weights applied to the symbols will be used for the entirety of the backtest, regardless of whether or not those weights were correct at that moment in history. So, when you’re testing groups of symbols with unevenly distributed weights, the further back your backtests go, the less reliable the results will be. For this reason, we suggest that you run these backtests across a wide variety of (uncorrelated if possible and if that makes sense in your strategy) symbols when possible and do not test these types of strategies further back than a year or two without seriously mistrusting the results. When running AutoAD live, make sure to update the weights and restart the bot as necessary according to your strategy.
Due to the limitations of backtesting strategies in TradingView which are based upon ever shifting weights to any great scale, strategy design is for us even more important. Well funded automated trading firms have the ability to use supercomputers and machine learning to help make decisions using vast data sets. Oftentimes, they will not (or need to) understand why their strategy works. Retail traders do not have this luxury. Basically, your strategies should make sense.
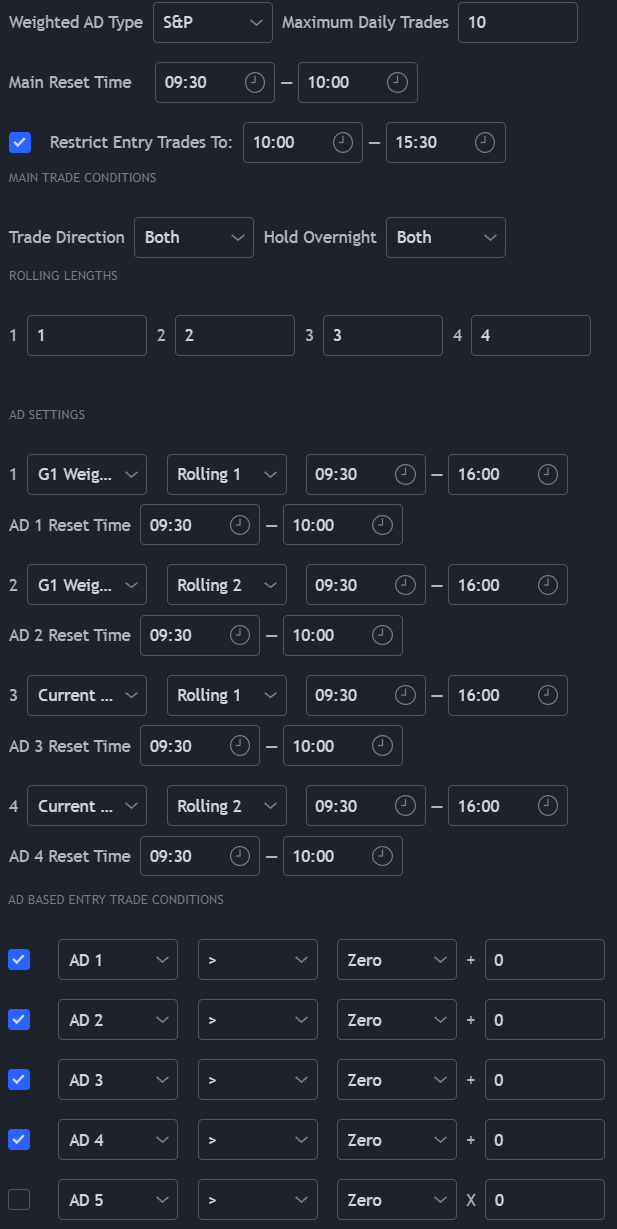
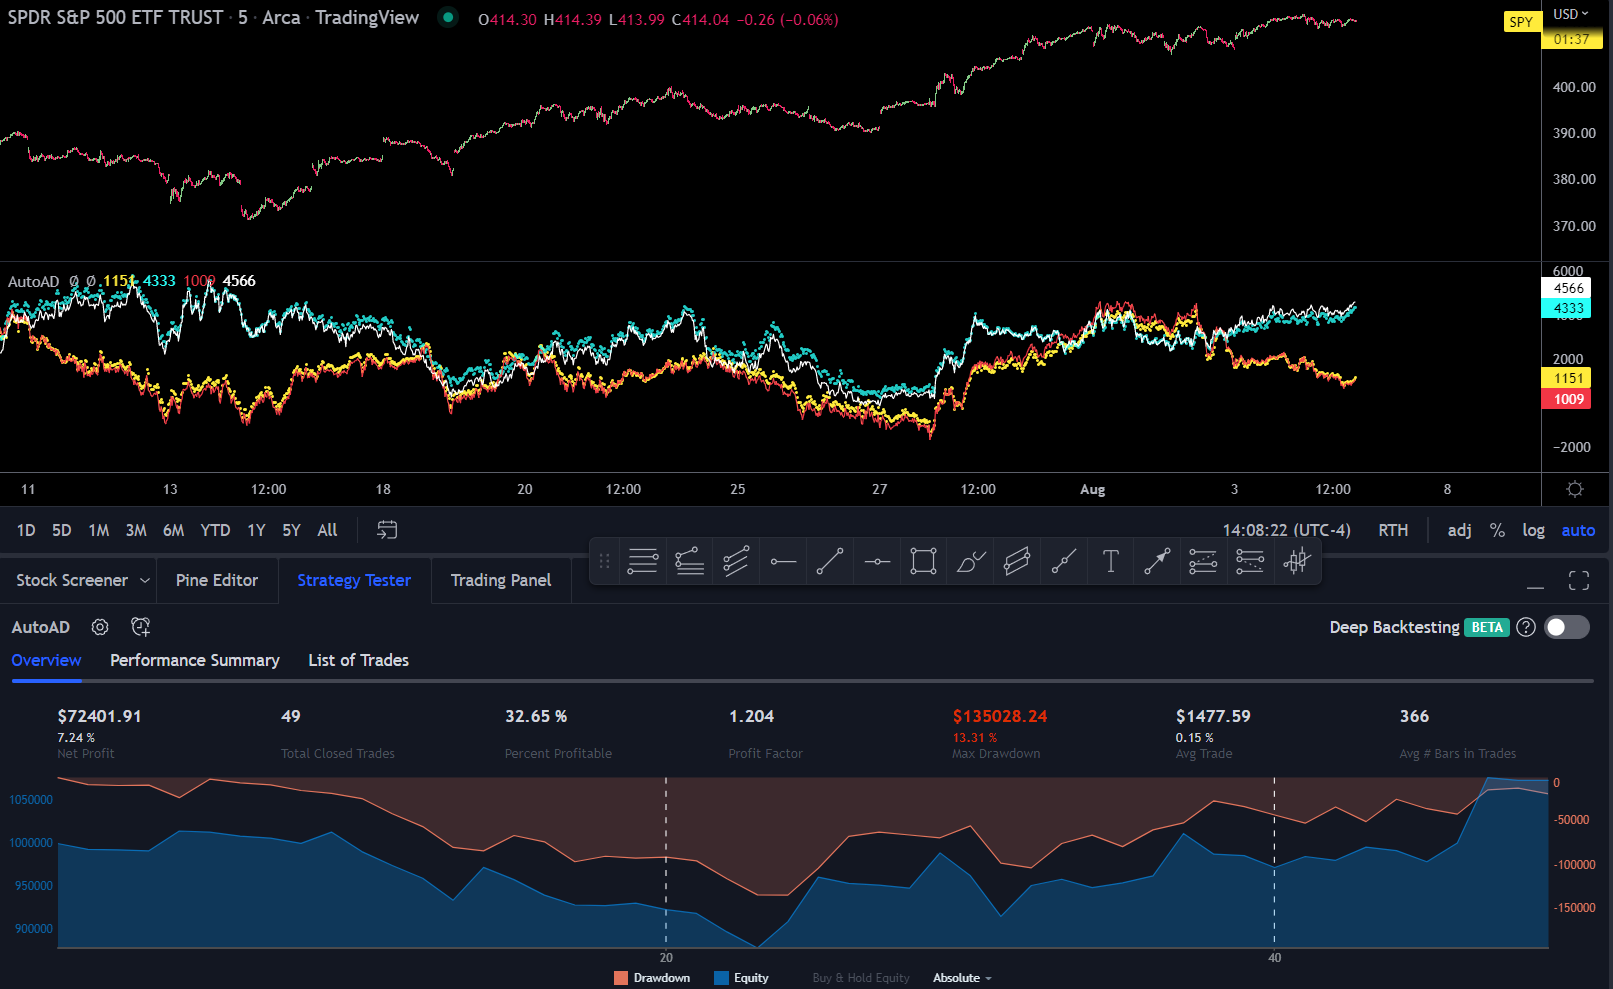
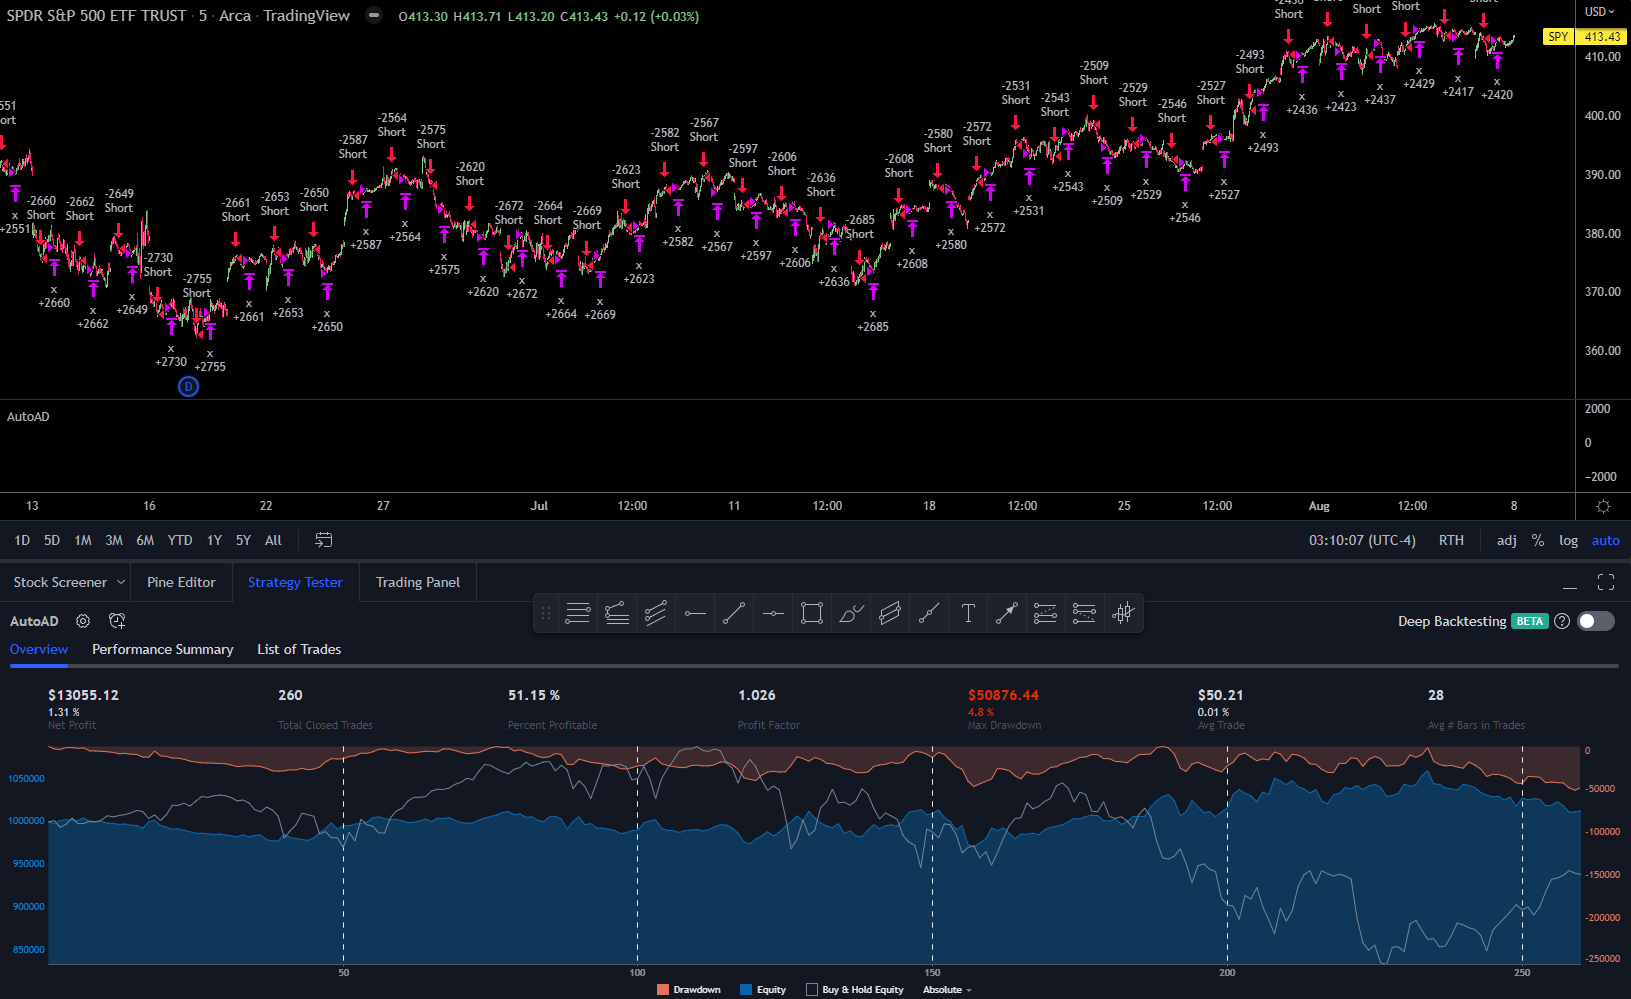
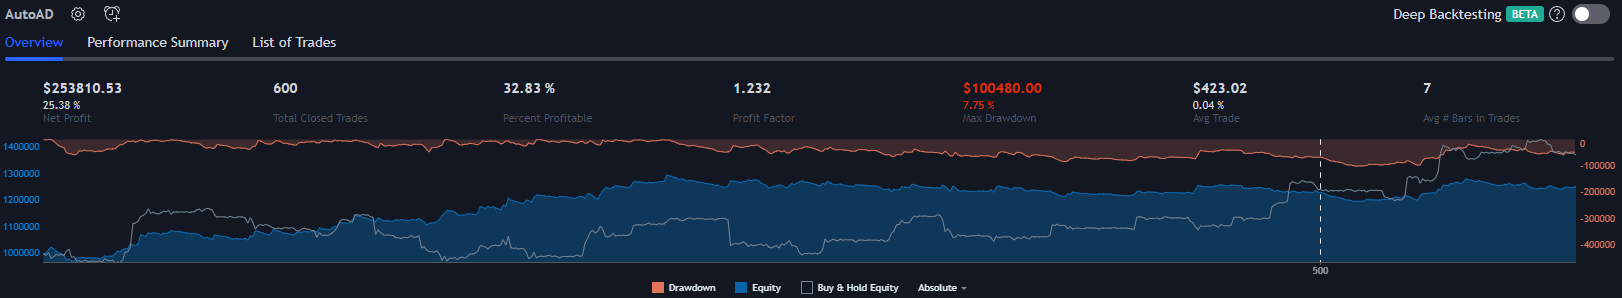
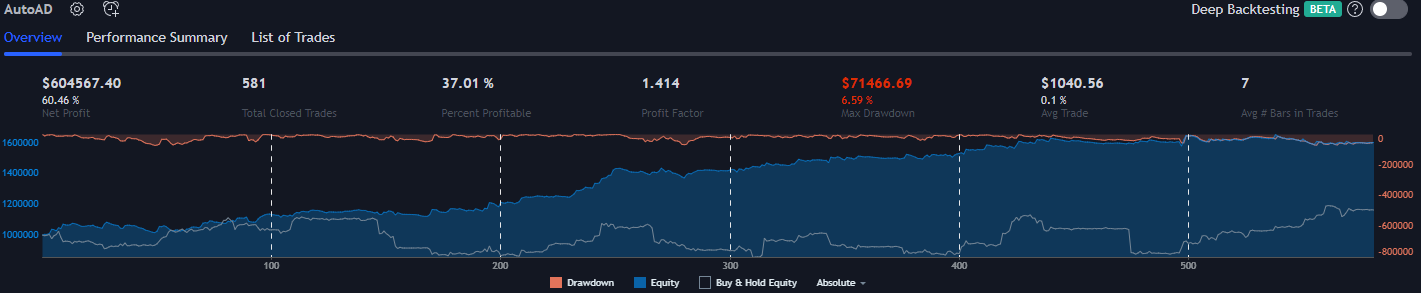
Basic S&P Trend Follower
This strategy uses the S&P preset, which uses the 11 S&P subsectors. It’s using the Weighted S&P AD. It will not trade in the first 30 minutes of the day, hopefully to avoid being chopped up. It will go long and short and will swing trades overnight.
Because a preset is used in the “Weighted AD Type” setting, the S&P AD is set to group 1. In the AD settings, AD 1 is set to be weighted and cumulative, AD 2 is set to be unweighted (equally weighted) and cumulative. AD 3 is set to be non-cumulative and weighted. If you don’t know what that means, read this.
There are technically three entry trade conditions for this strategy, but in reality, there are four. This is because the strategy will not enter into a new trade if the stop loss conditions are true. The entry trade conditions are:
AD 1 (the weighted S&P AD) must be greater than 1000 to enter into long trades (the S&P according to it’s subcomponents, weighted, should be greater than 1%) or must be less than -1000 to enter into short trades.
AD 1 (weighted) must be greater than AD 2 (unweighted) for long trades. For short trades, the weighted must be below the unweighted. The weighted sectors must lead the move.
AD 3 (the non-cumulative weighted AD) should be negative for long trades and positive for short trades. Basically, this condition waits for pullbacks.
The current price of the chart the strategy has been applied to must be below (or above for shorts) the midpoint of the day. The midpoint is the half way point between the high and low of the day. This functions as a trailing stop loss.
There is technically one exit trade conditions, however, the entry trade conditions cannot be true if the strategy is going to exit out of a trade. So, in reality, there are four exit trade conditions. They are the inverse of the conditions above. Basically, the first three conditions cannot be true and the chart must be below i't’s midpoint to exit out of a long trade. It must be above the midpoint to exit out of a long trade.
The reason why 1% is used in the first entry trade condition is because when the weights of a group total 100, AutoAD will produce numbers which equal about 1000 times the total percentage move of the group. So, if all of the constituents of a group (and therefore the AD to which the group is applied) move higher by 1% from the start of the accumulation period, AutoAD will read 1000 for this AD, weighted or unweighted (because in this example, it would be the same).

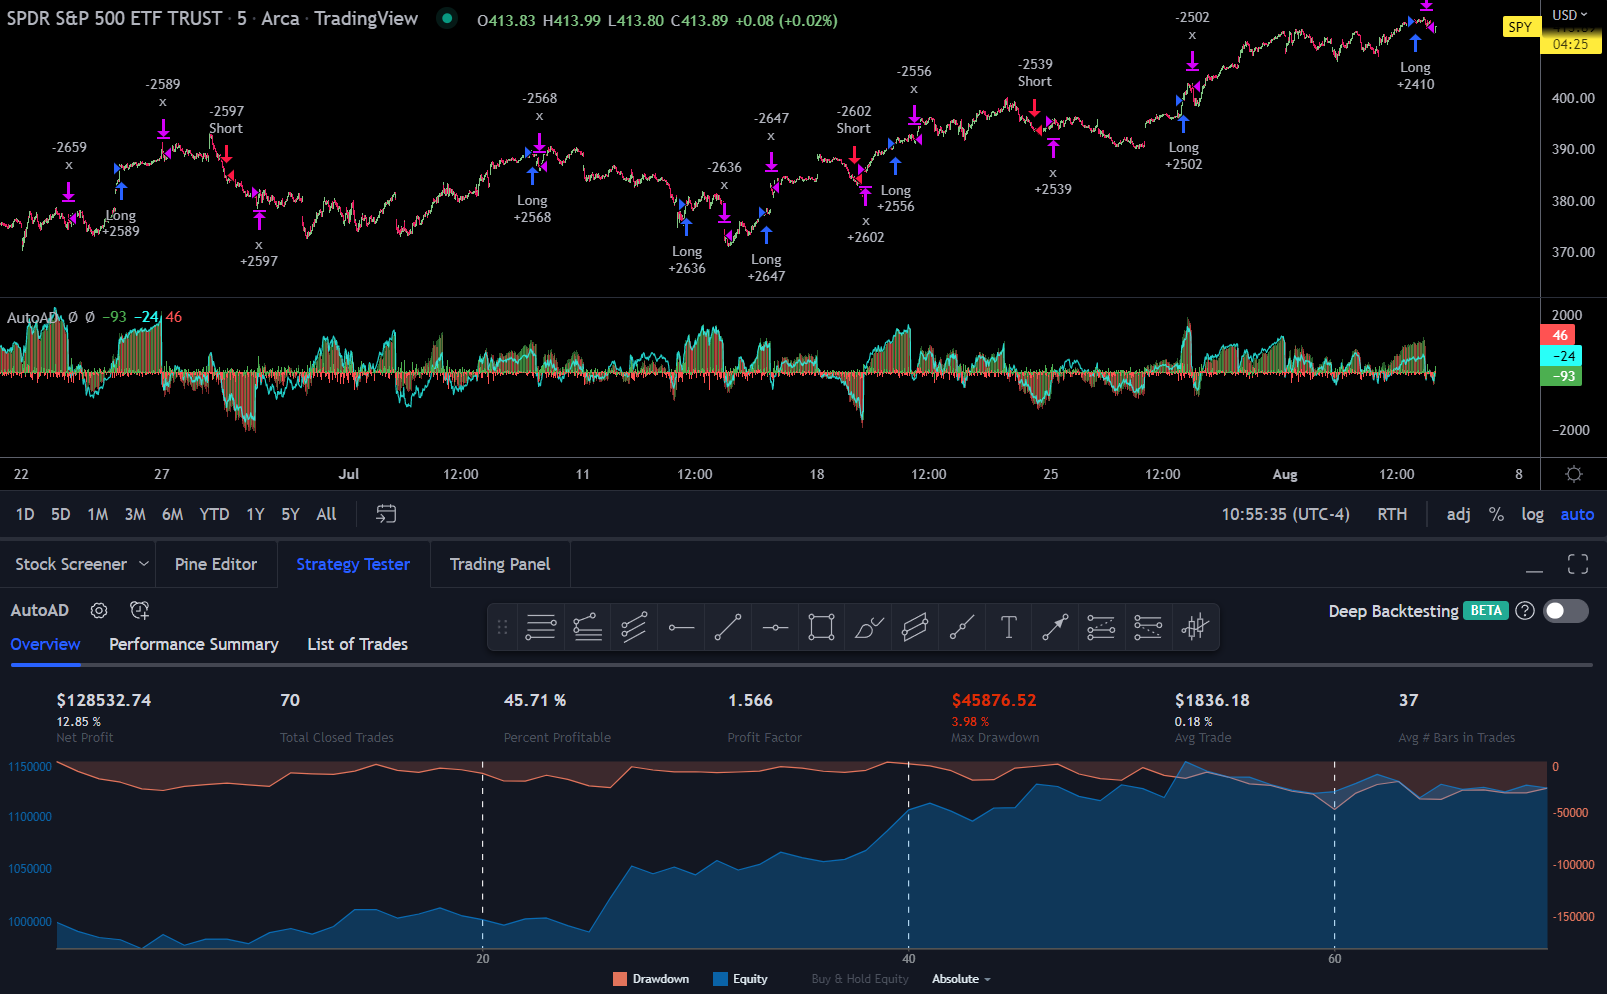
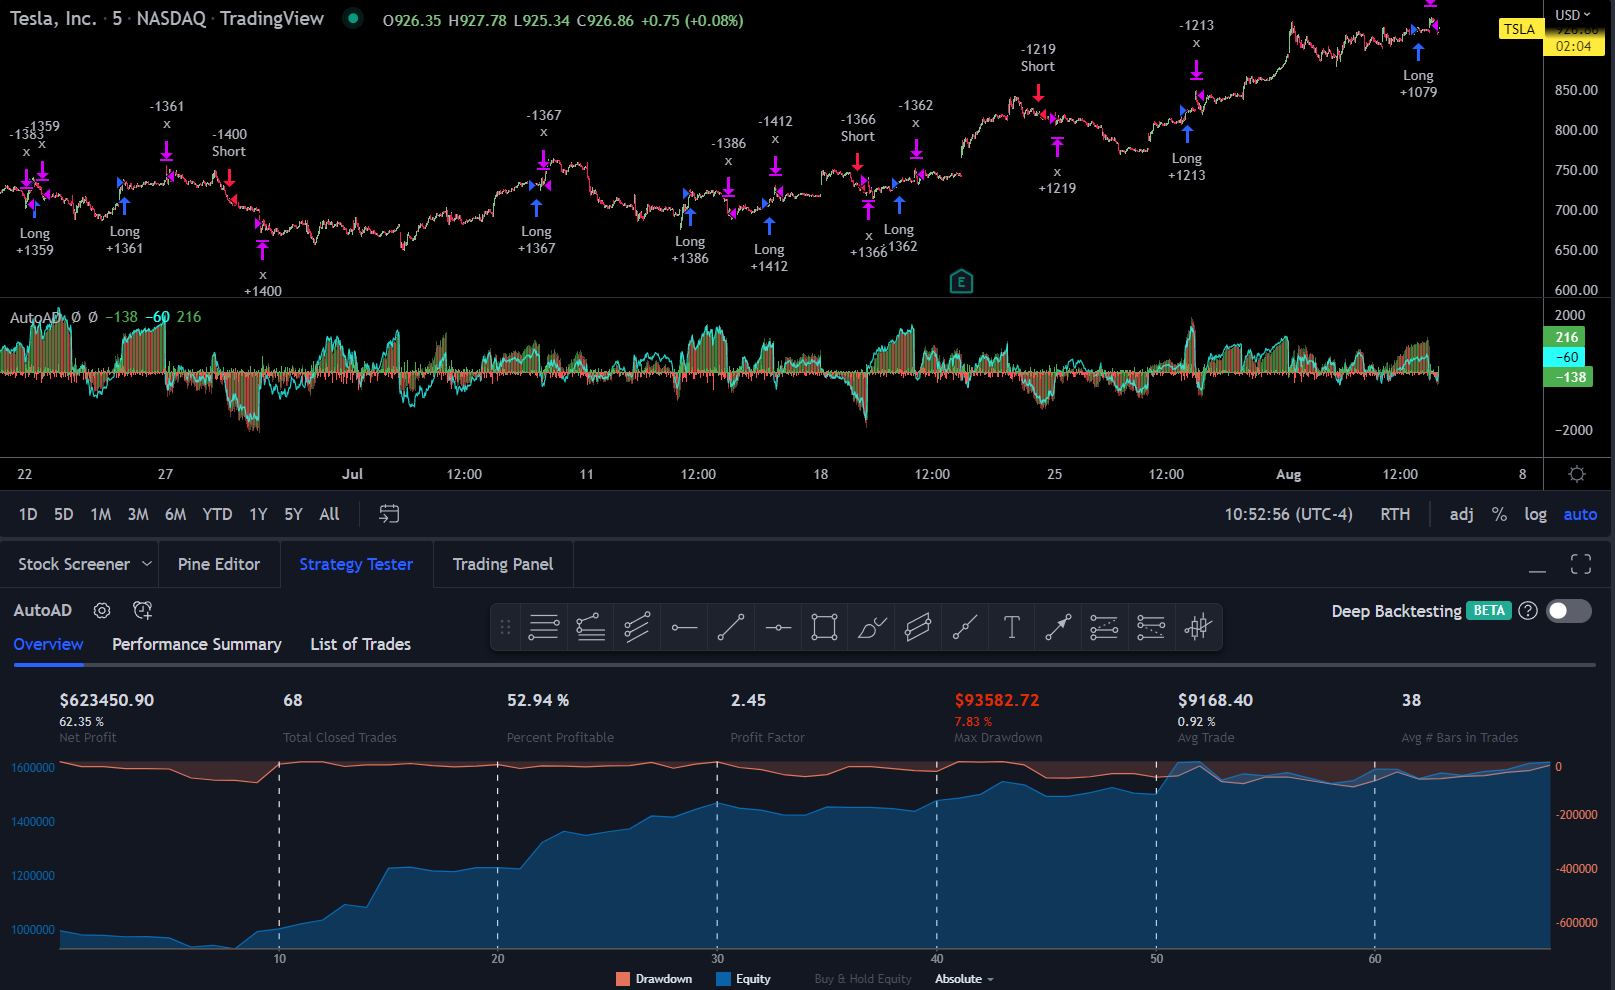
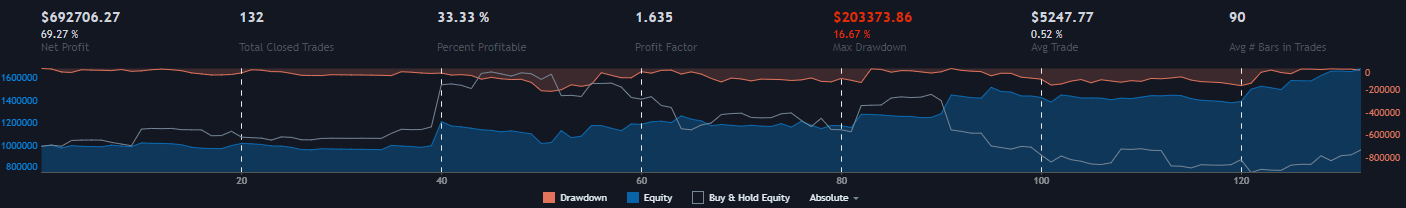
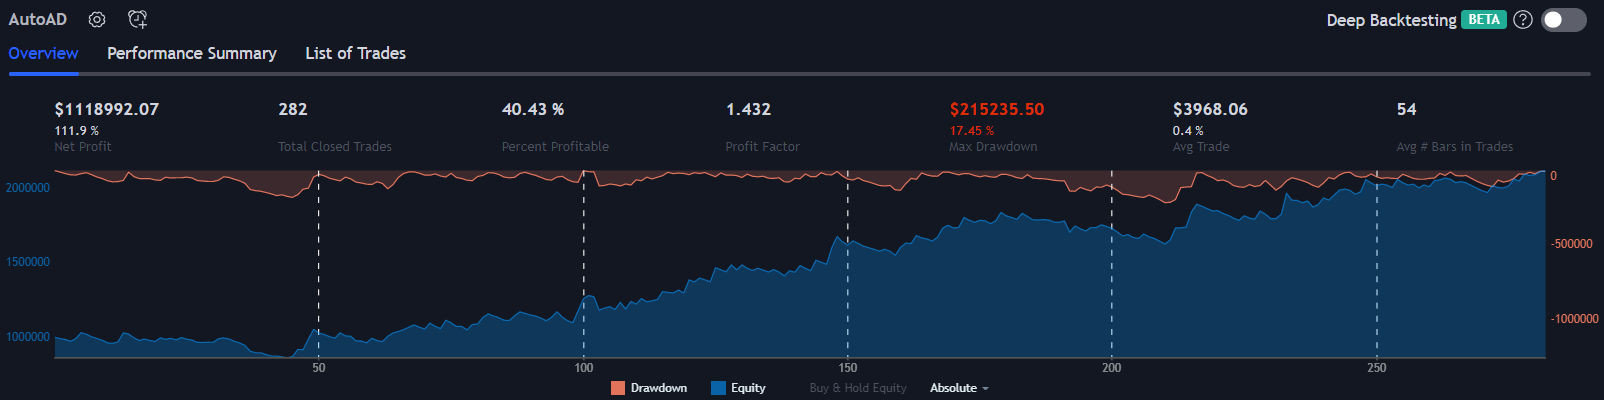
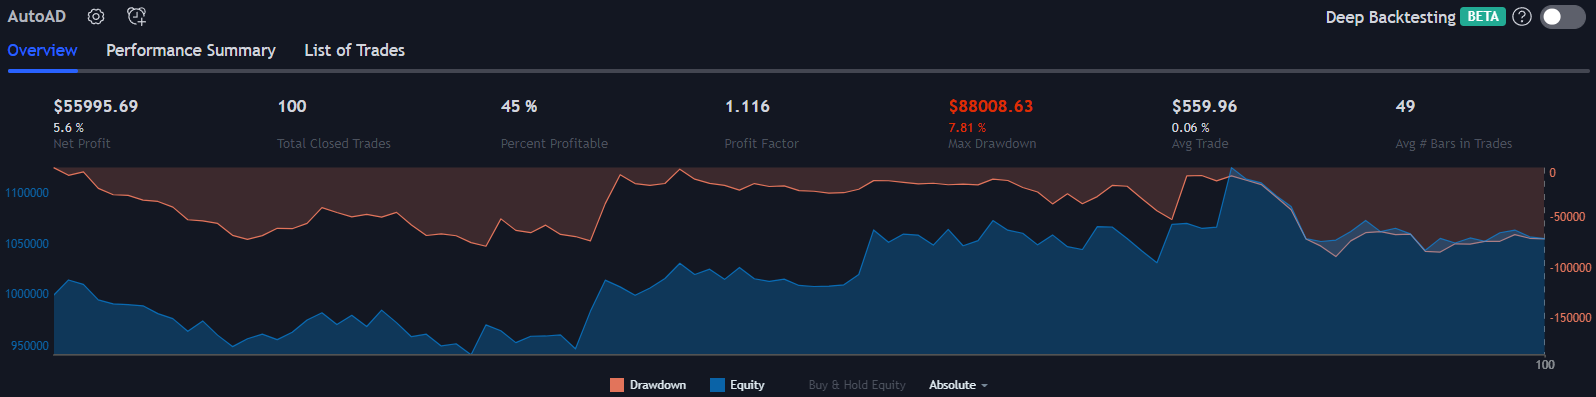
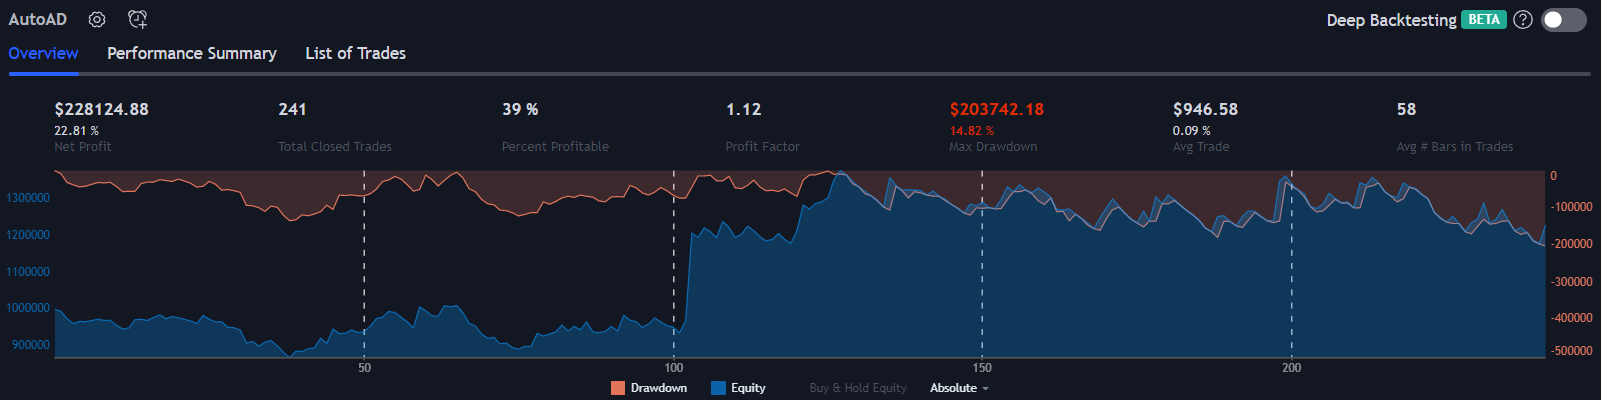
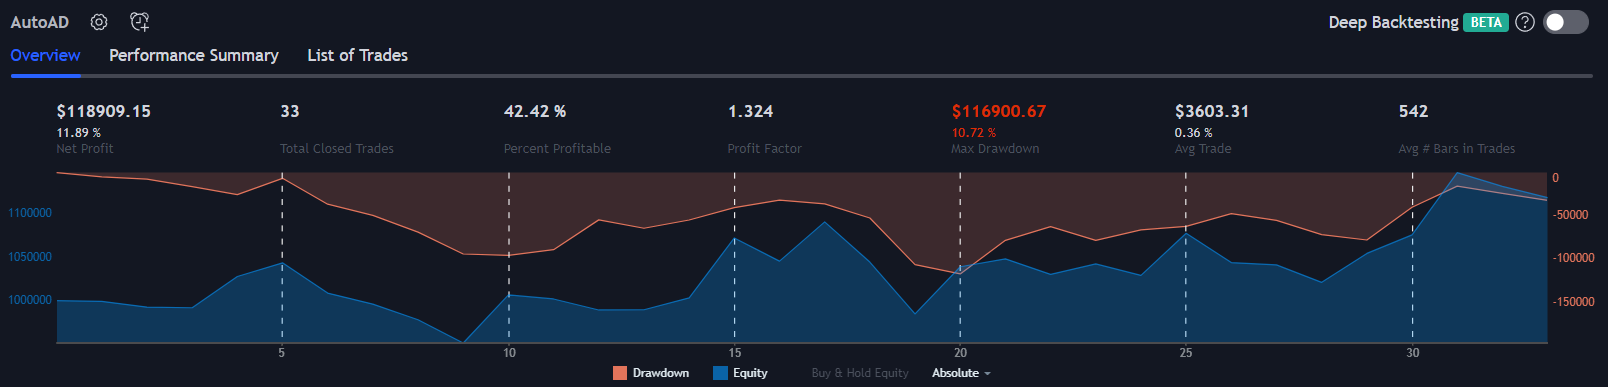
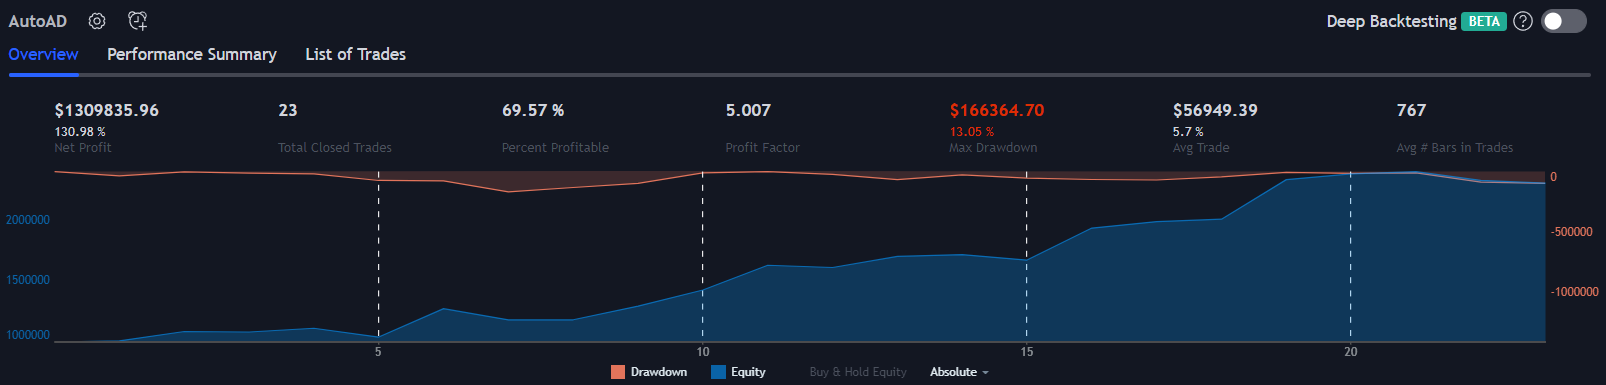
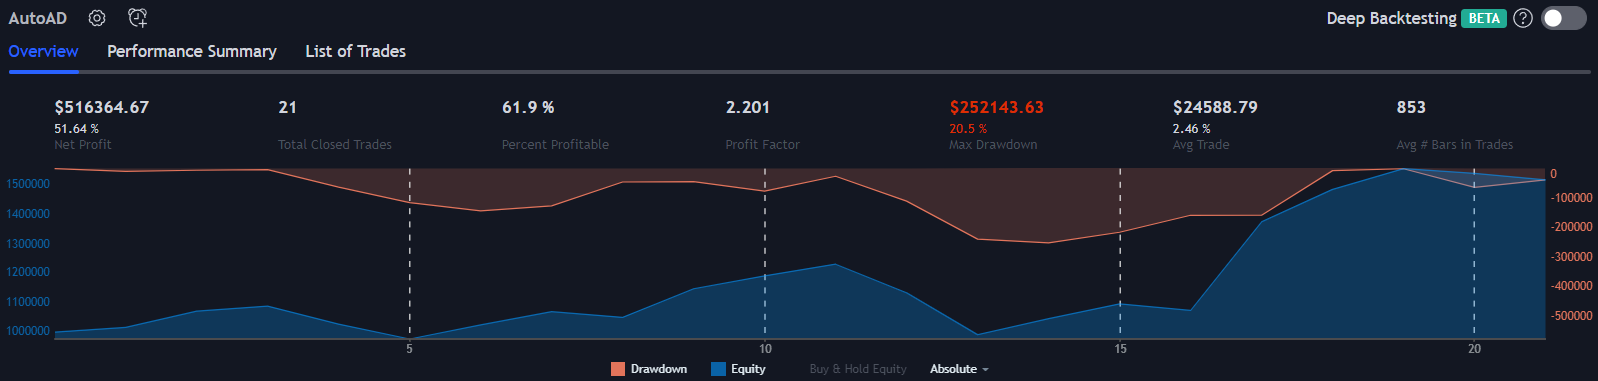
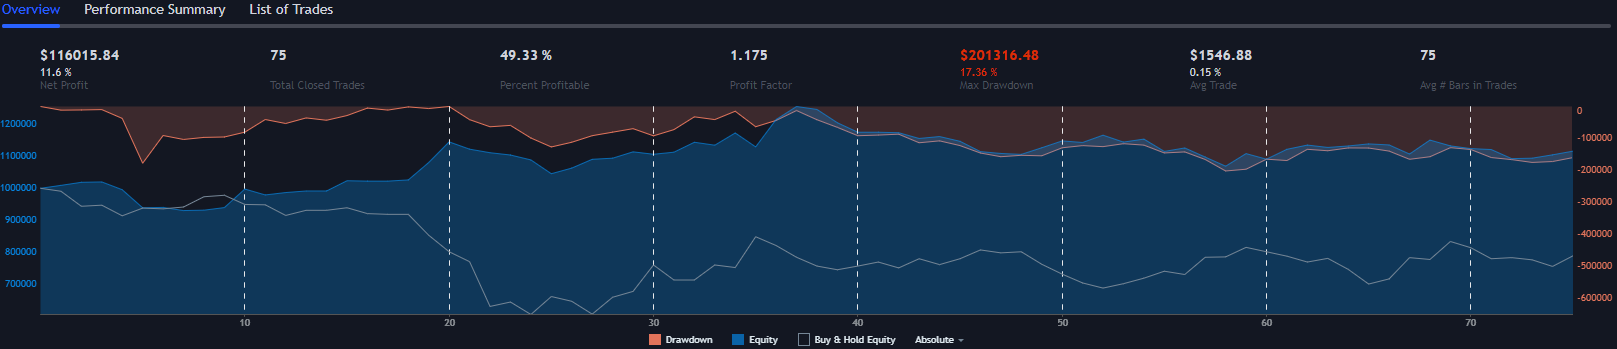
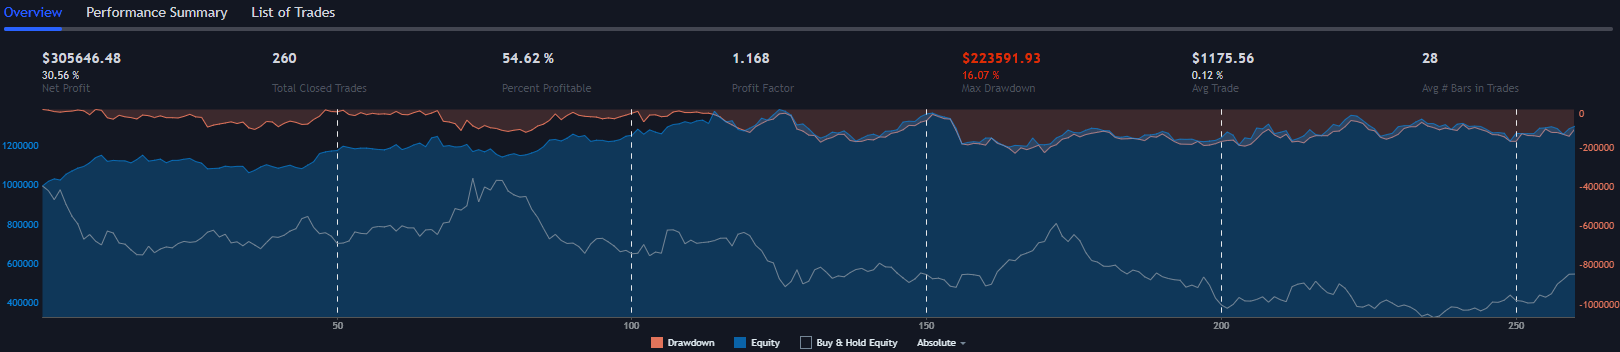
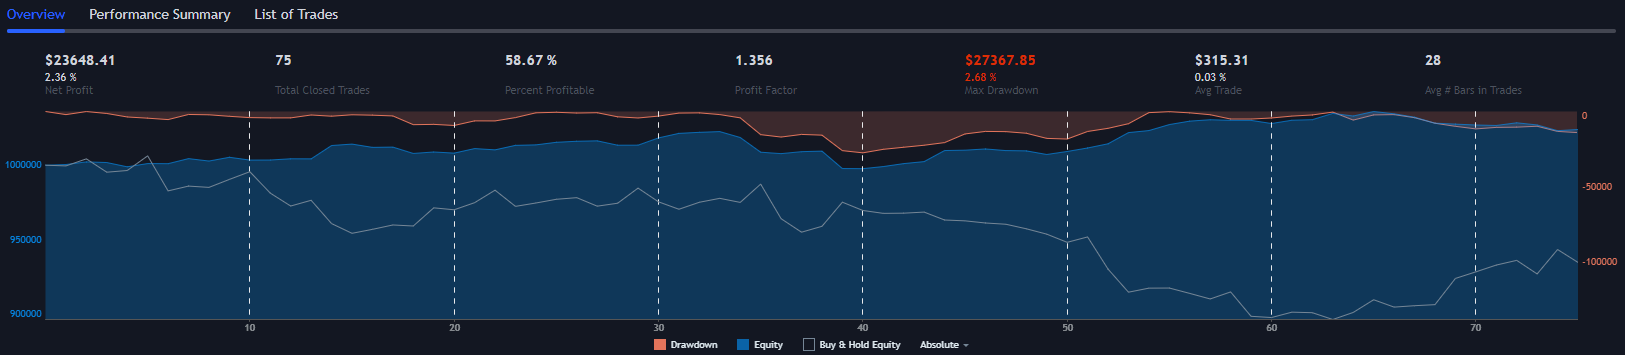
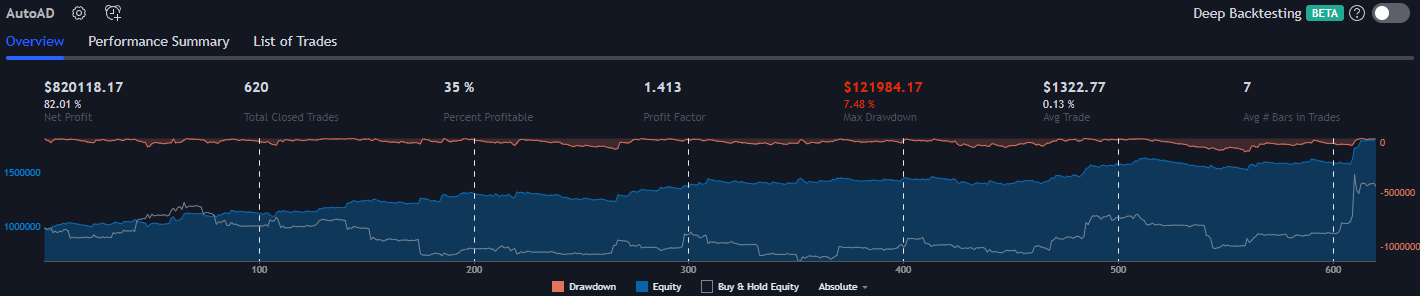
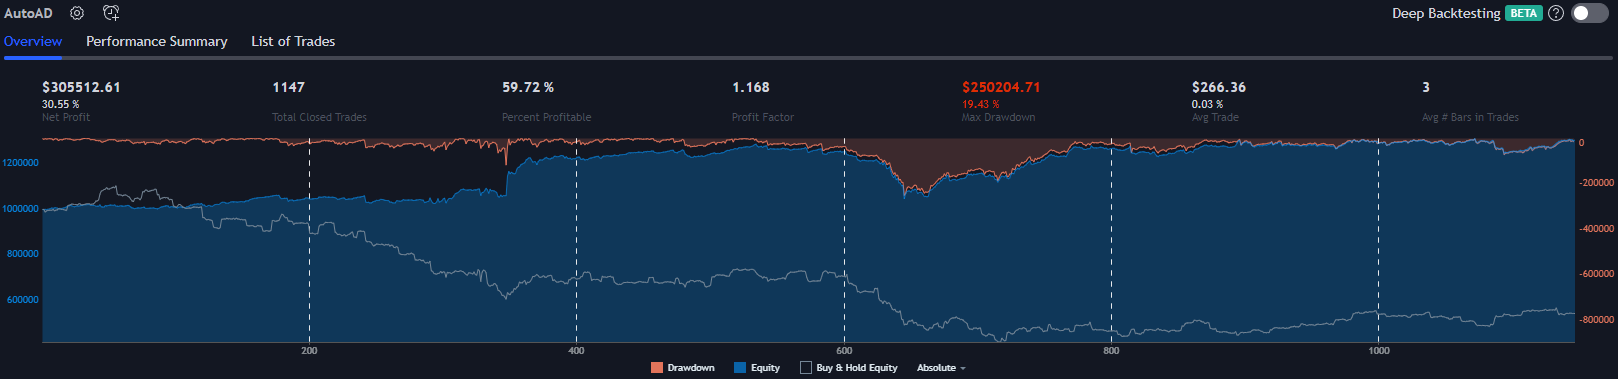
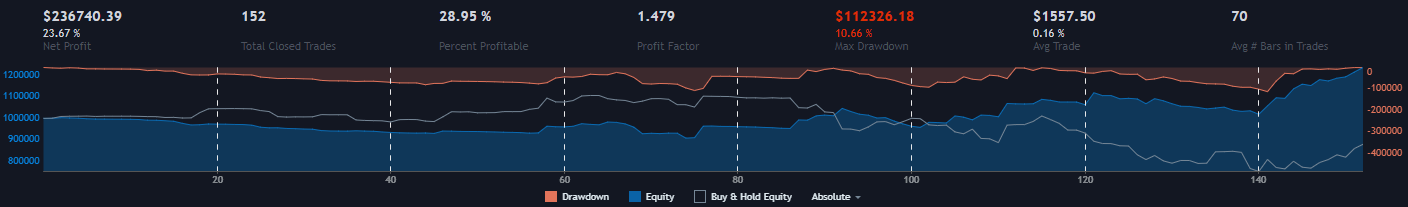
This is a good result. Because the strategy was profitable on the SPY over this period, it stands to reason that any symbol which is highly correlated with the SPY and also has more volatility is likely to perform even better. One of the most volatile and also highly correlated symbols with the SPY is TSLA. When using the S&P AD, it makes sense to apply the data to assets which are not only in the S&P, but also in as many other correlated American ETFs as possible.
Compare the shape of the return on investment graph for both tests. You’ll see that they are basically the same shape, but TSLA’s net profit is a lot higher. That’s because TSLA usually moves in the same direction as the SPY and the entry and exit times will have occurred at very similar times on both backtests. The only condition which uses the chart which the strategy is applied to is the midpoint based stop loss. Below are some more ROI graphs using the same timeframe and settings without the charts to save space.
AMZN:
AAPL:
QQQ:
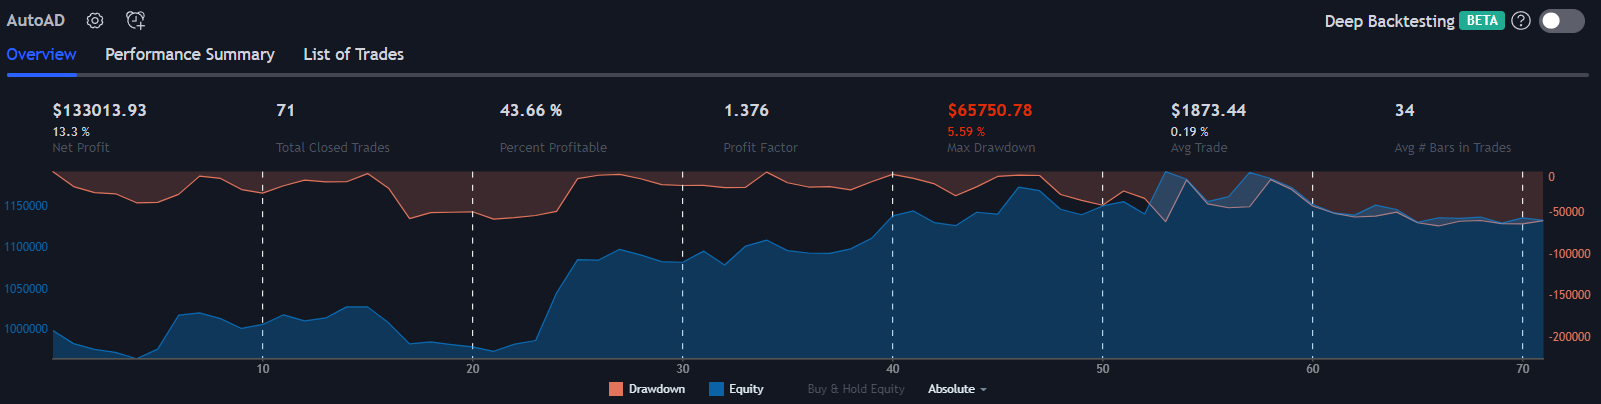
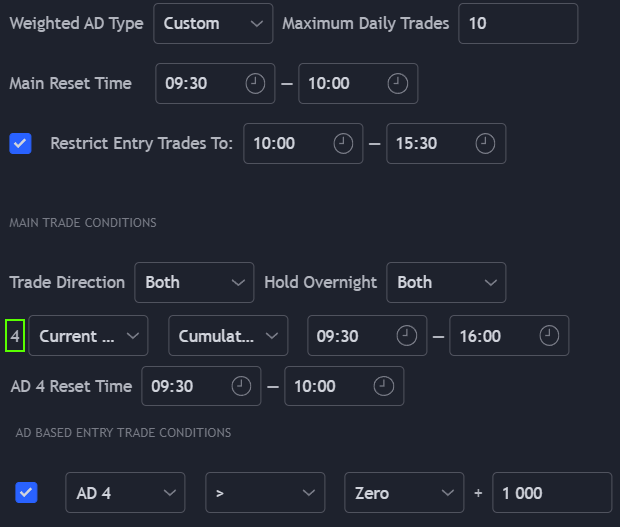
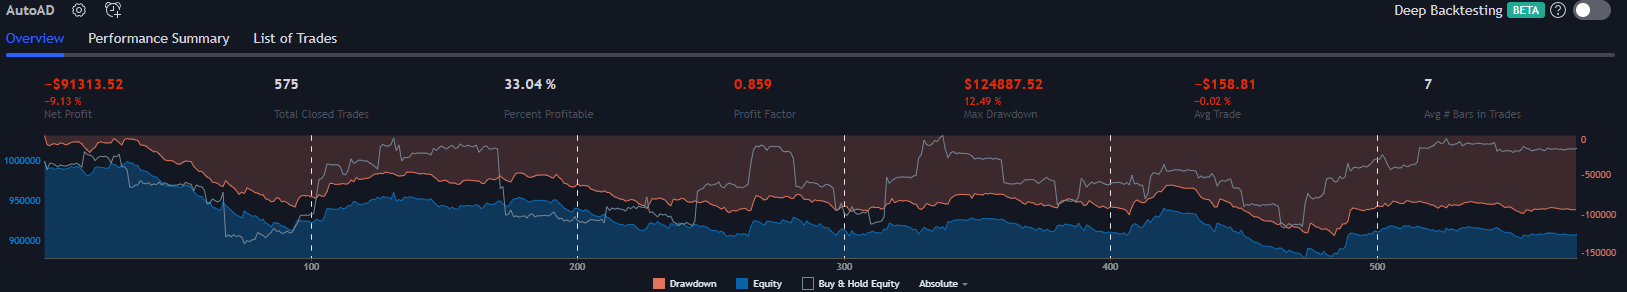
2. Current Chart Trend Follower
This strategy doesn’t use any groups of symbols; it’s trade conditions are only based on the chart which the strategy is applied to. In this instance, the AD will track the performance of the chart, excluding gaps. Just like the other Weighted ADs, the accumulation resets at the market open.
By using the ‘Custom’ choice from ‘Weighted AD Type’; AD 4 is set to the current chart, cumulative. There is only one trade condition used here - the chart’s AD must be greater than (or less than for shorts) 1000 (+/- 1% from the open).
The settings you see are the settings which are enabled and used - no other trade conditions are used. That means, trades are only ever made when the chart moves at least 1% from the open. That means, if you’re in a long trade and the chart declines by 0.5% every day, never dropping more than 1% from the open on any single day, the losing trade will never exit. You must make sure that you’re closely following any automated strategy if it doesn’t use stop losses, such as this one.
The plots for AD 1 to AD 3 have been disabled in the ‘Style’ tab of the settings menu. AD 4 has been enabled in white.
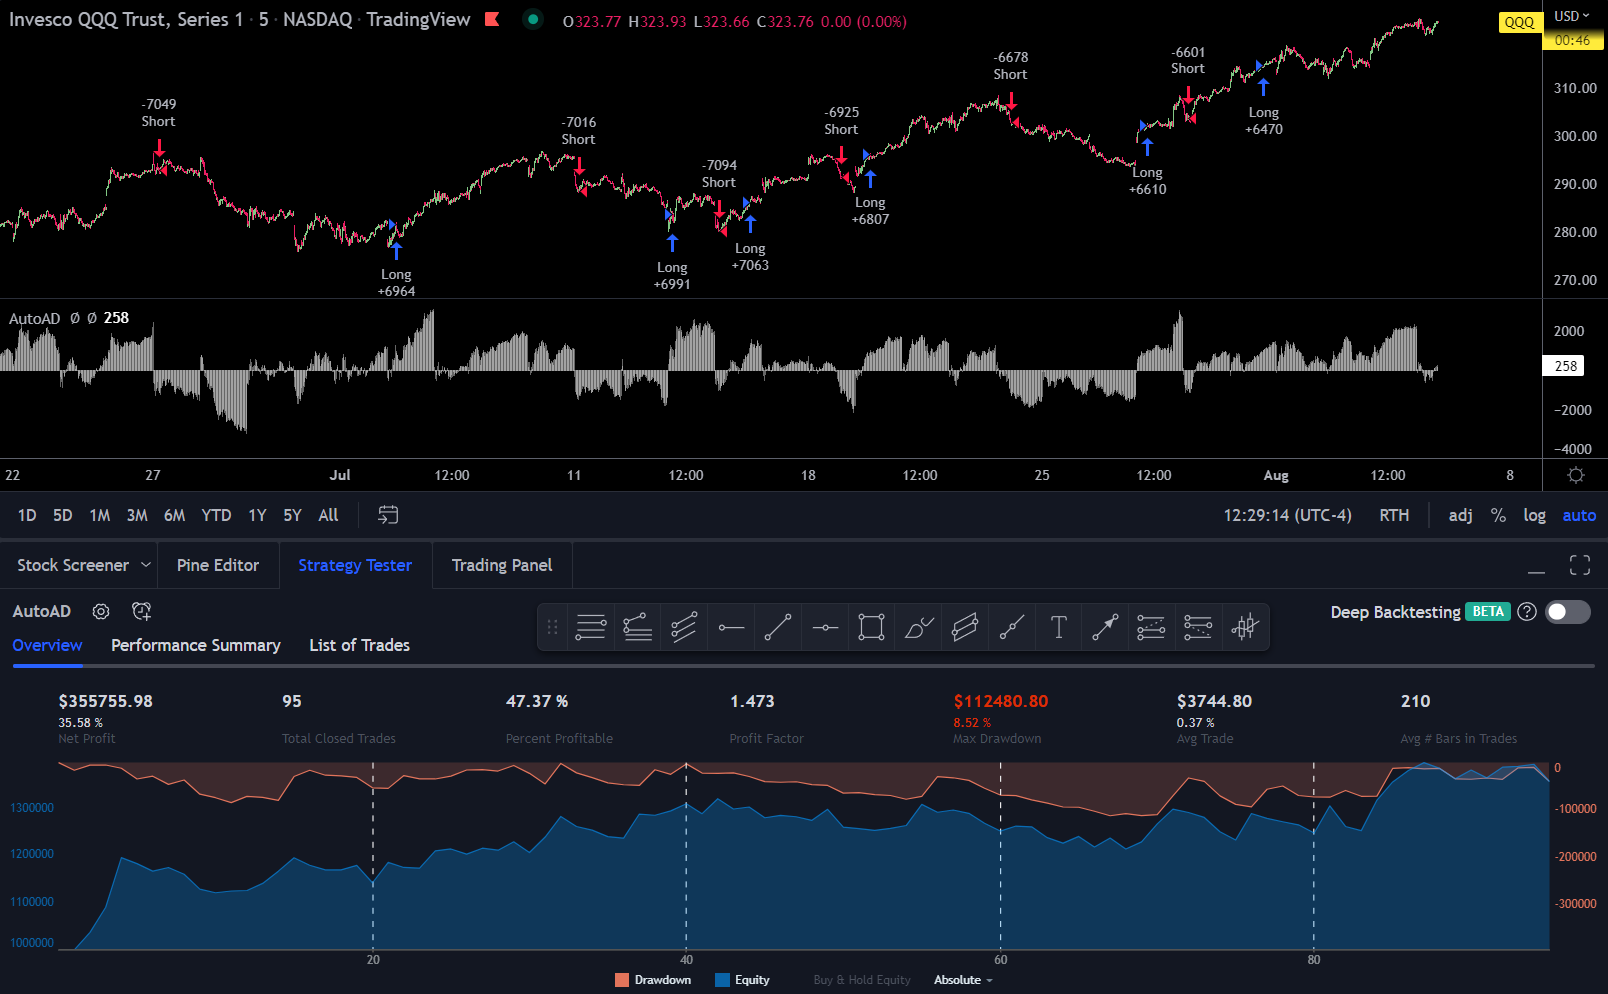
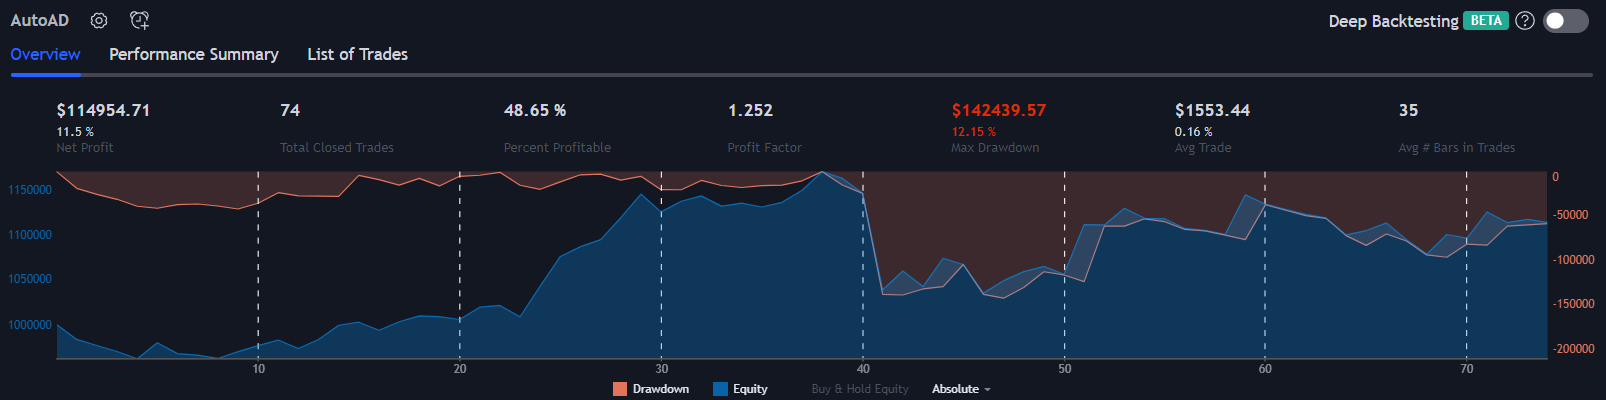
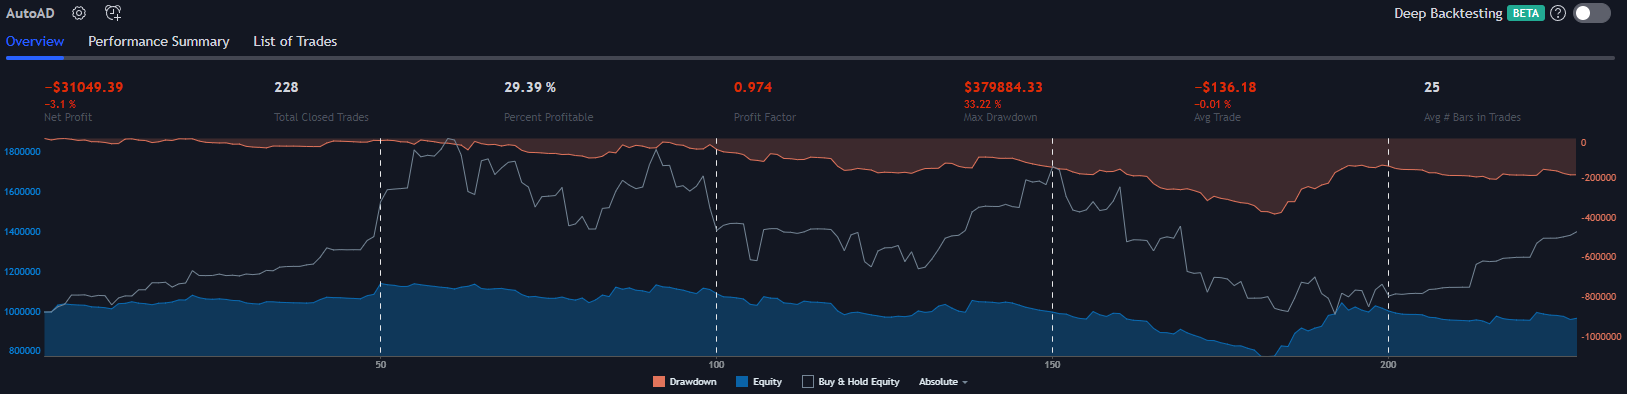
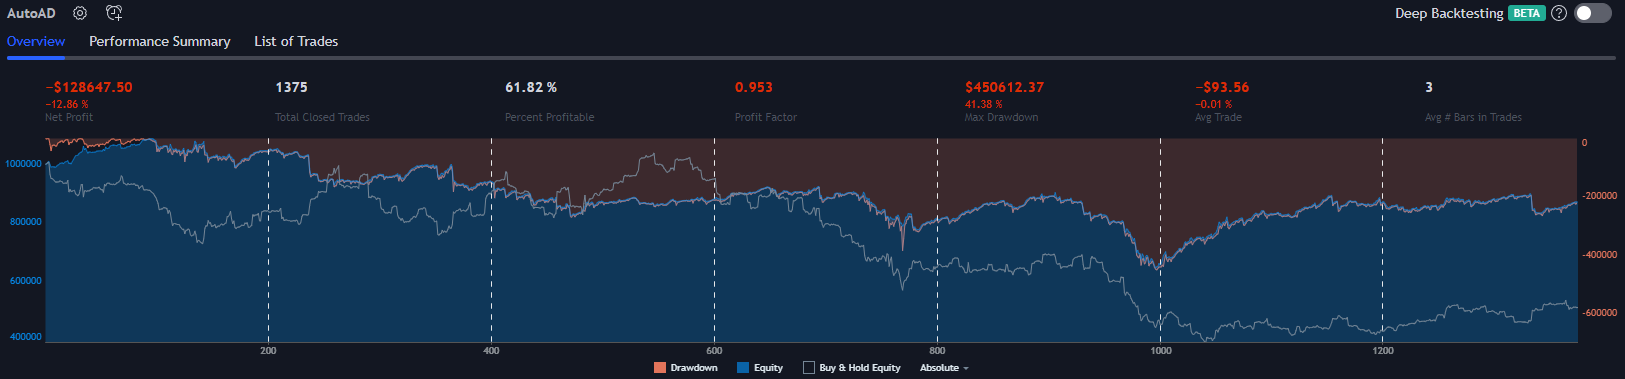
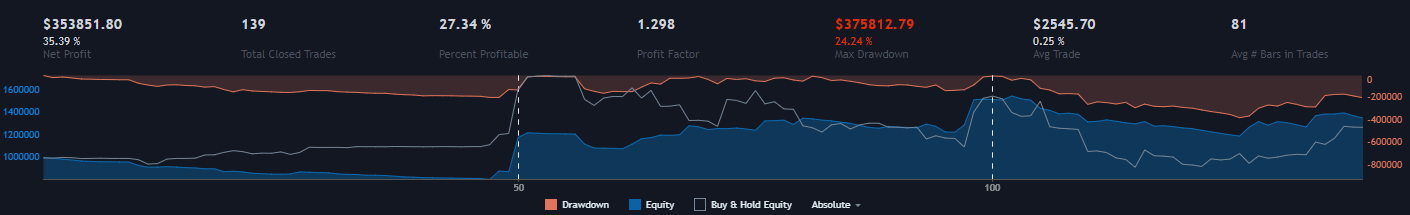
Looks great! Let’s try it on TSLA:
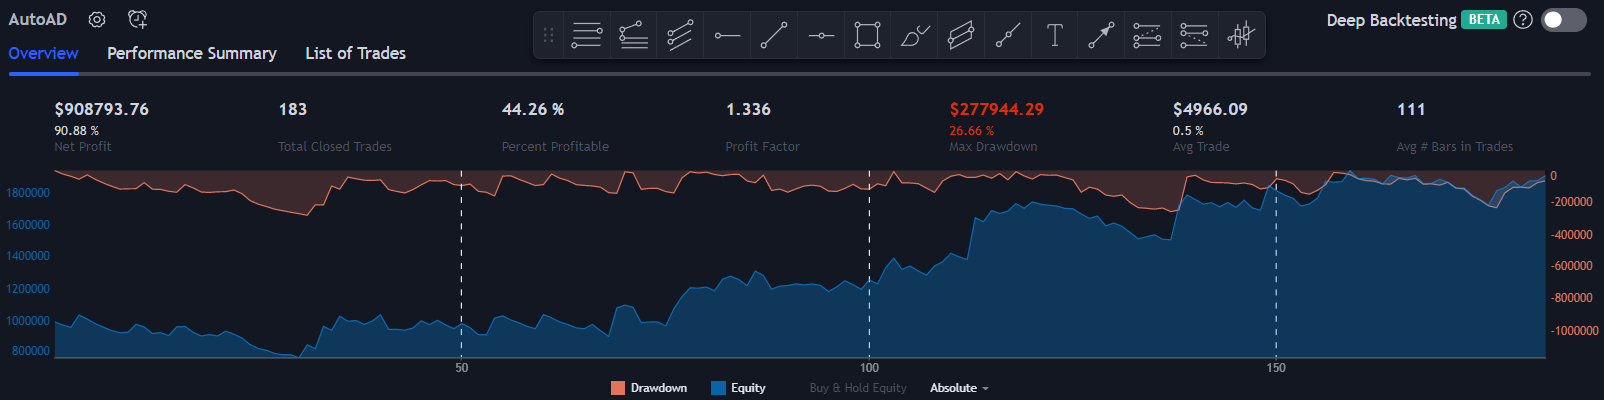
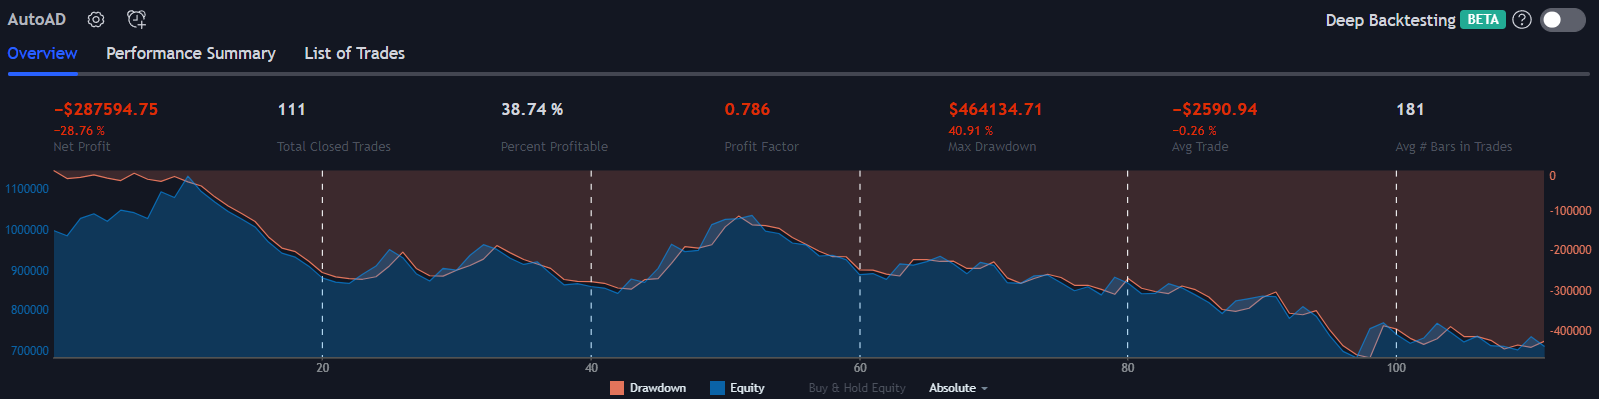
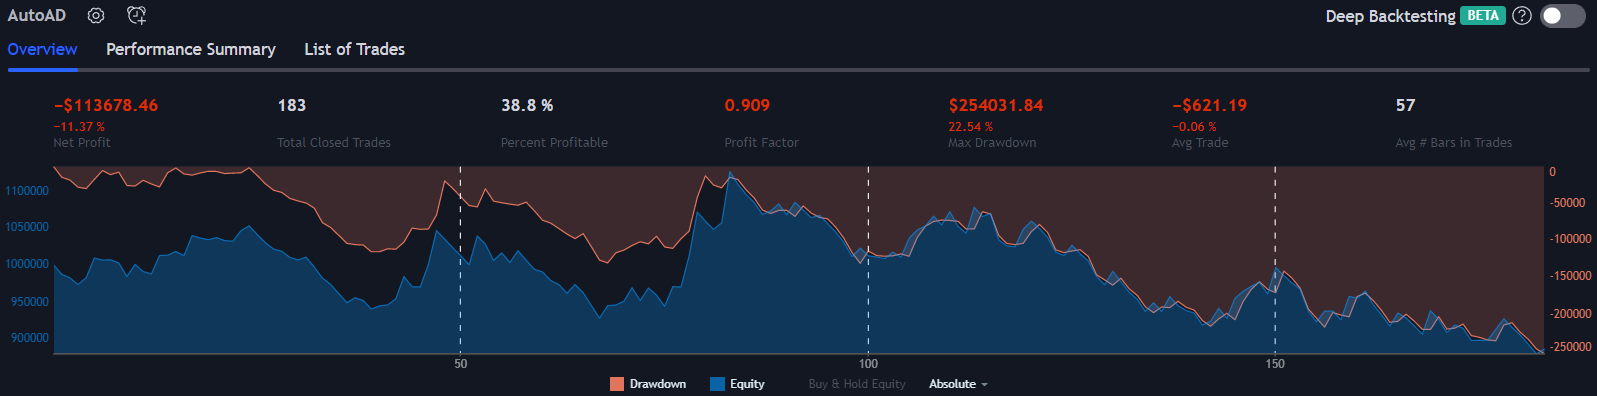
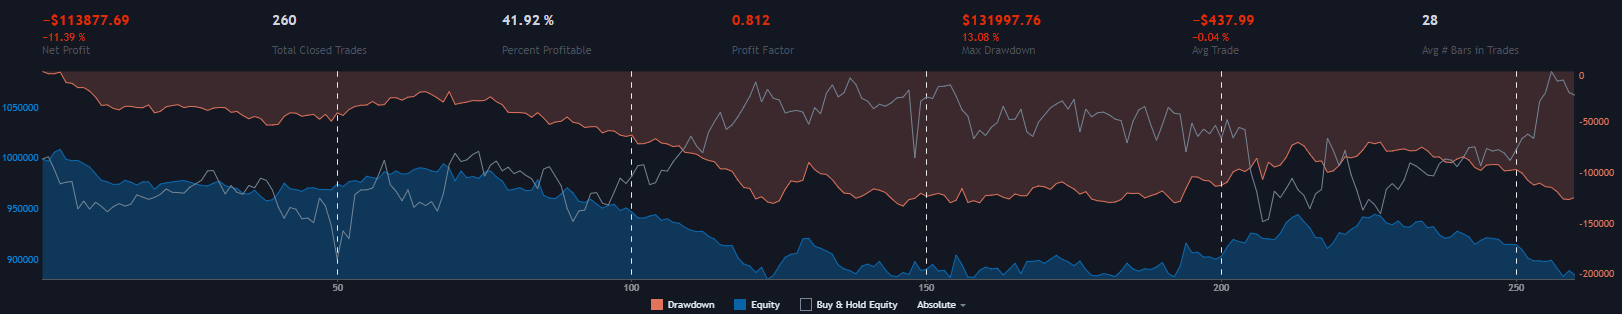
At first glance, this looks great. However, the 26% drawdown is a big red flag. It may seem easy to tolerate when compared with a 90% net profit, but if your strategy immediately lost 26%, wouldn’t it seem sensible to turn it off?
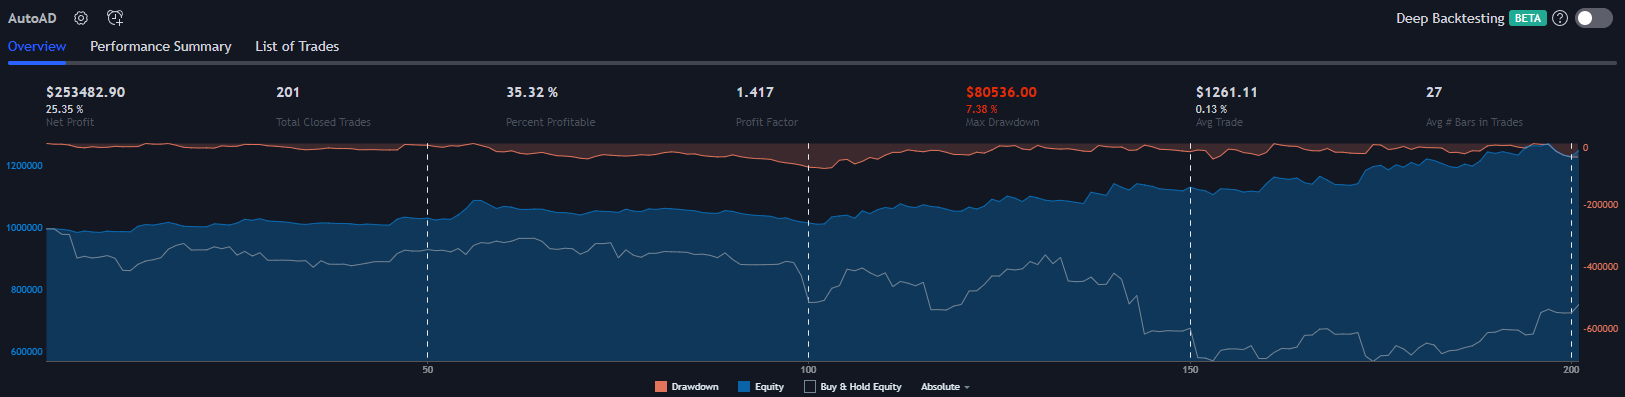
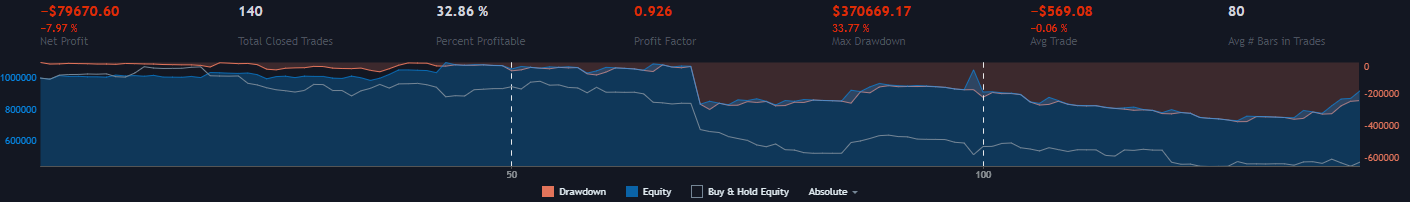
SPY:
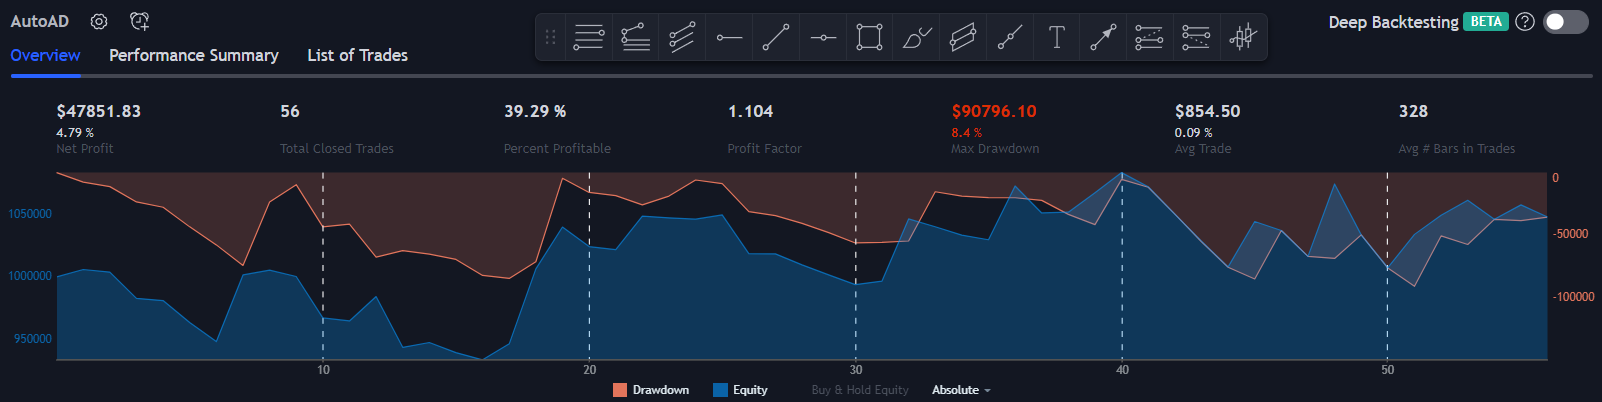
This is bad.
FB / META:
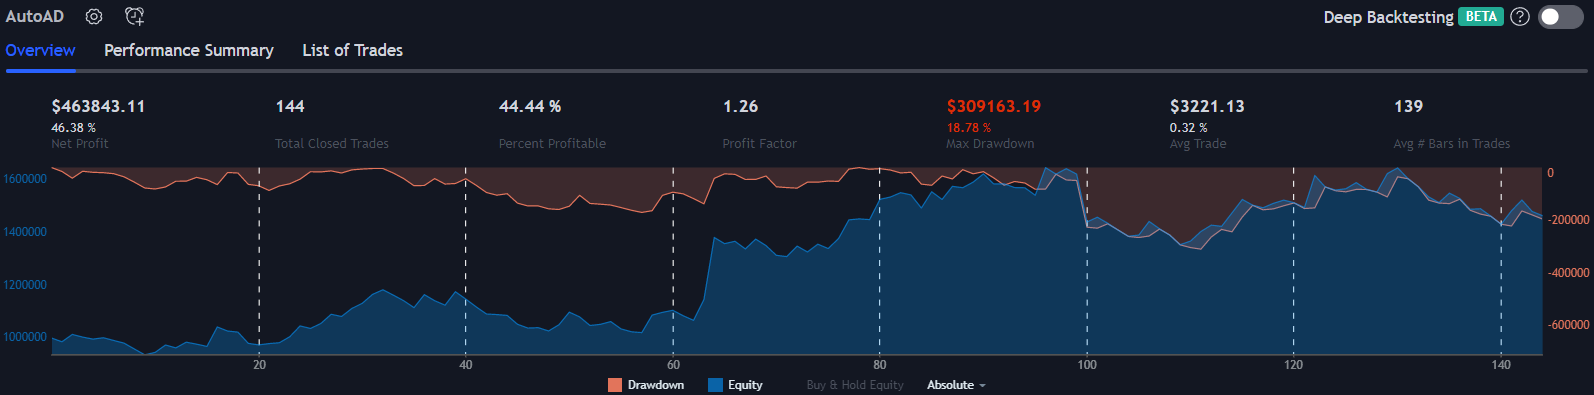
MSFT:
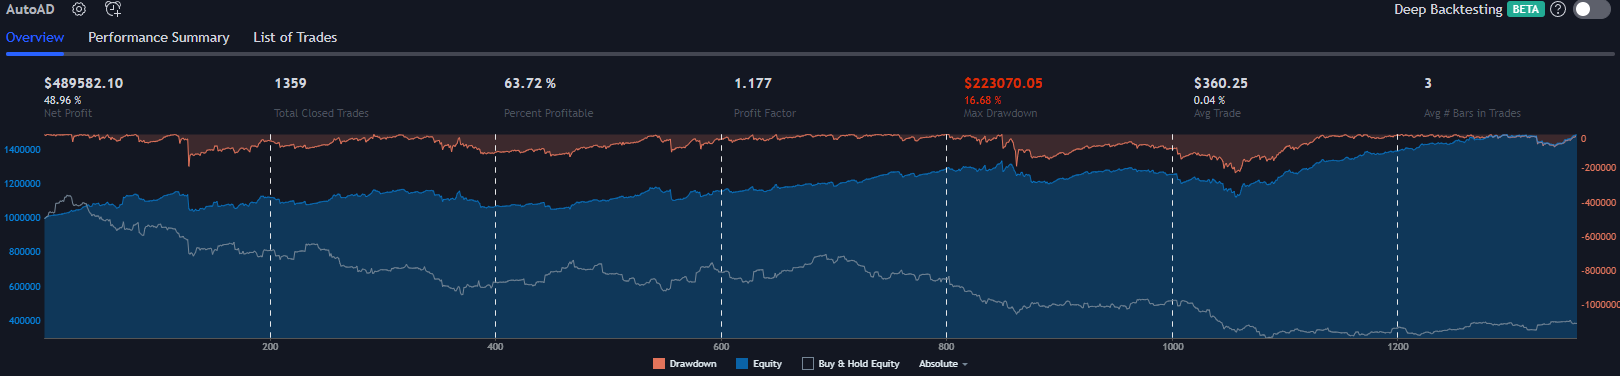
Next, a stop loss will be added to this strategy to see if it will improve.
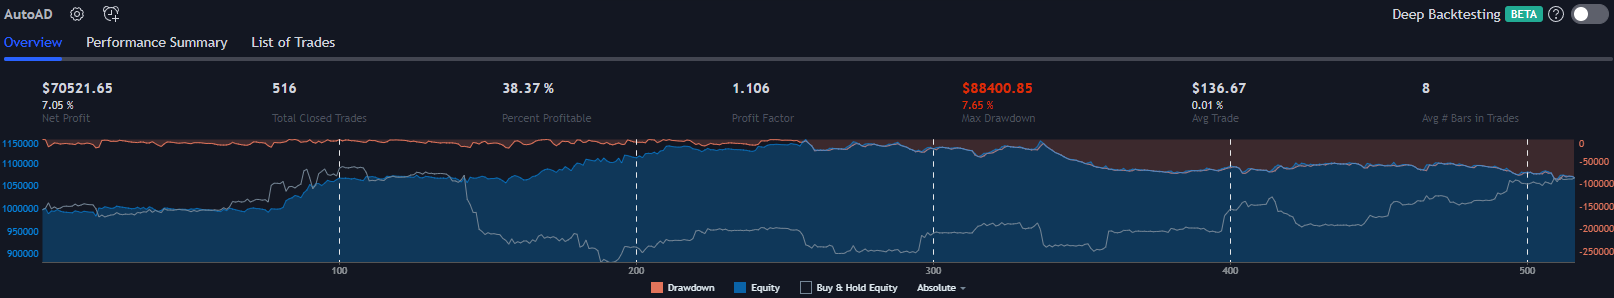
3. Current Chart Trend Follower with Stop Loss
For this strategy, the stop loss will be the open price of the day. So, in addition to the previous example:
Long trades will now be stopped out if the price drops back below the open
Short trades will now be stopped out if the price climbs back above the open
By adding this condition, drawdowns may be reduced, but the total number of trades will be increased.
TSLA:
SPY:
META:
MSFT:
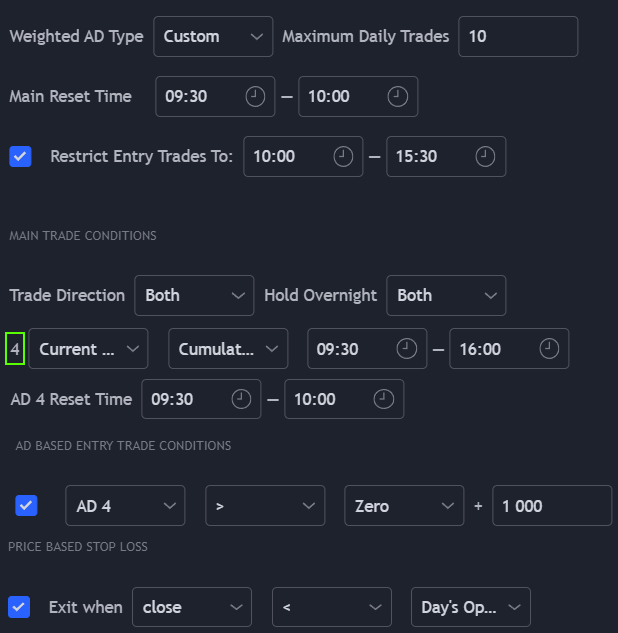
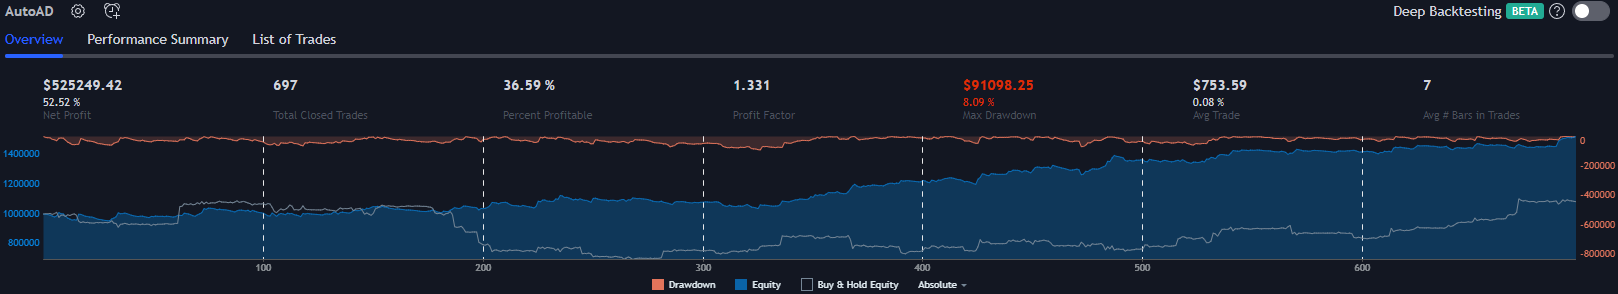
4. S&P and Current Chart Roller
In this example, rolling will be applied on both the Weighted S&P AD and also on the current chart. Most of the same basic settings are applied.
AD 1 and AD 2 are set to the Weighted S&P AD. AD 3 and AD 4 are set to the current chart.
Rolling 1 (set here to 1 day of data) is applied to AD 1 and AD 3. Rolling 2 (set here to 2 days worth of data) is applied to AD 2 and 4.
Long trades will be entered when all four ADs are positive. So, when both the S&P and the current chart are positive (excluding gaps) over the last 24 and 48 hours, long trades will be entered.
Short trades will be entered when all four ADs are negative; when both the S&P and current chart are negative (excluding gaps) over the last 24 and 48 hours.
No stop loss is used. If there is a strong correlation between the S&P and the symbol this strategy is applied to, it will not remain in losing trades indefinitely.
In the following chart:
AD 1 is plotted as yellow circles
AD 2 is plotted as blue circles
AD 3 is plotted as a red line
AD 4 is plotted as a white line
When the S&P AD is applied to the SPY, there is (as there should be) a strong correlation between the S&P AD and the current chart’s AD.
QQQ:
TSLA:
AMZN:
ADBE:
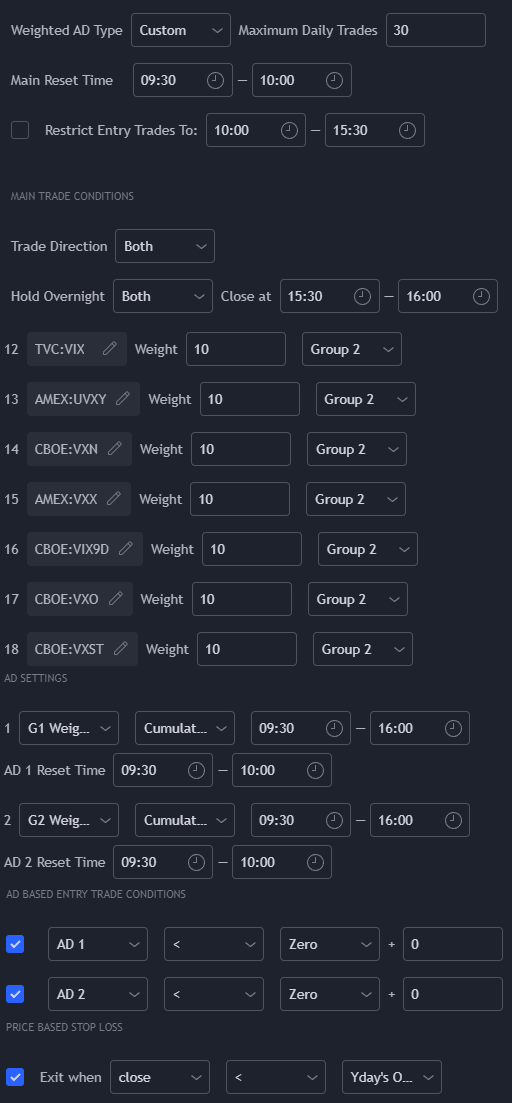
5. S&P, Volatility & Internals
This strategy uses the Weighted S&P AD, UVXY to gauge volatility and the internal symbols TICK and ADD.
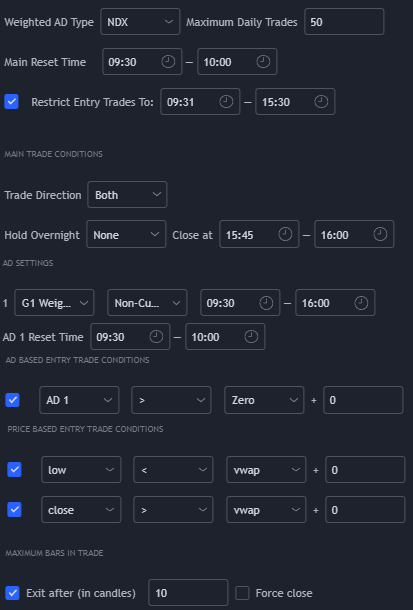
The Weighted AD Type setting is set to Custom as the strategy will use two groups. 5 trades per day has been set as an arbitrary maximum.
For this example, as per the Trade Direction setting, the strategy will only enter into long trades. Short trade conditions shall be used to exit positions instead of entering into short trades.
Because ‘Hold Overnight’ has been set to ‘None’, any open position will be exited on the first candle after 15:30.
The first 11 symbols have been set to group 1 to build the Weighted S&P AD. Symbol 22 has been set to the UVXY. Because this symbol is in a group by itself, the weight has been set to 100% so that it’s output will equal about 1000 for a 1% move.
AD 1 has been set to Group 1; weighted and cumulative.
AD 2 has been set to Group 2; weighted (although this makes no difference to unweighted because AD 2 consists of only one symbol) and cumulative.
Both ADs use the standard 9:30 to 16:00 New York time for US symbols.
For this long only strategy, the entry trade conditions are:
AD 1 (The Weighted S&P AD) must be positive on the day, measured from the open.
AD 2 (The UVXY) must be negative on the day, measured from the open.
TICK must measure above 100.
ADD must measure above 100.
The symbol which the strategy is applied to (the current chart) must be above it’s opening price. (This is the inverse of the stop loss condition.)
The closing conditions of the strategy are:
None of the first four entry trade conditions can be true.
The symbol which the strategy is applied to must be below it’s opening price of the day.
In the examples below the ‘buy and hold’ performance has been included on the performance chart as a white line. For those who are familiar with the SPY’s chart over this time, you’ll see that in the first example, the strategy’s performance closely resembles the SPY’s chart. That’s because the entry conditions selected result in relatively frequent long exposure. Notice that this strategy, while only going long, was able to outperform the SPY during a time when the SPY lost about 5%. Whether or not using this strategy would have actually outperformed the SPY depends on slippage and commissions. Generally the spread on the SPY is very tight, but commissions will still play a large role for those with smaller accounts and may render this strategy ineffective.
Notice the relative performance of this strategy compared to ‘buy and hold’ in the examples below. Only going long during a bear market is playing the game on hard mode.
For those who are interested, this same strategy with ‘Hold Overnight’ enabled had a loss of 2% but still outperformed SPY over this duration.
QQQ:
TSLA:
AMZN:
ADBE:
ROKU:
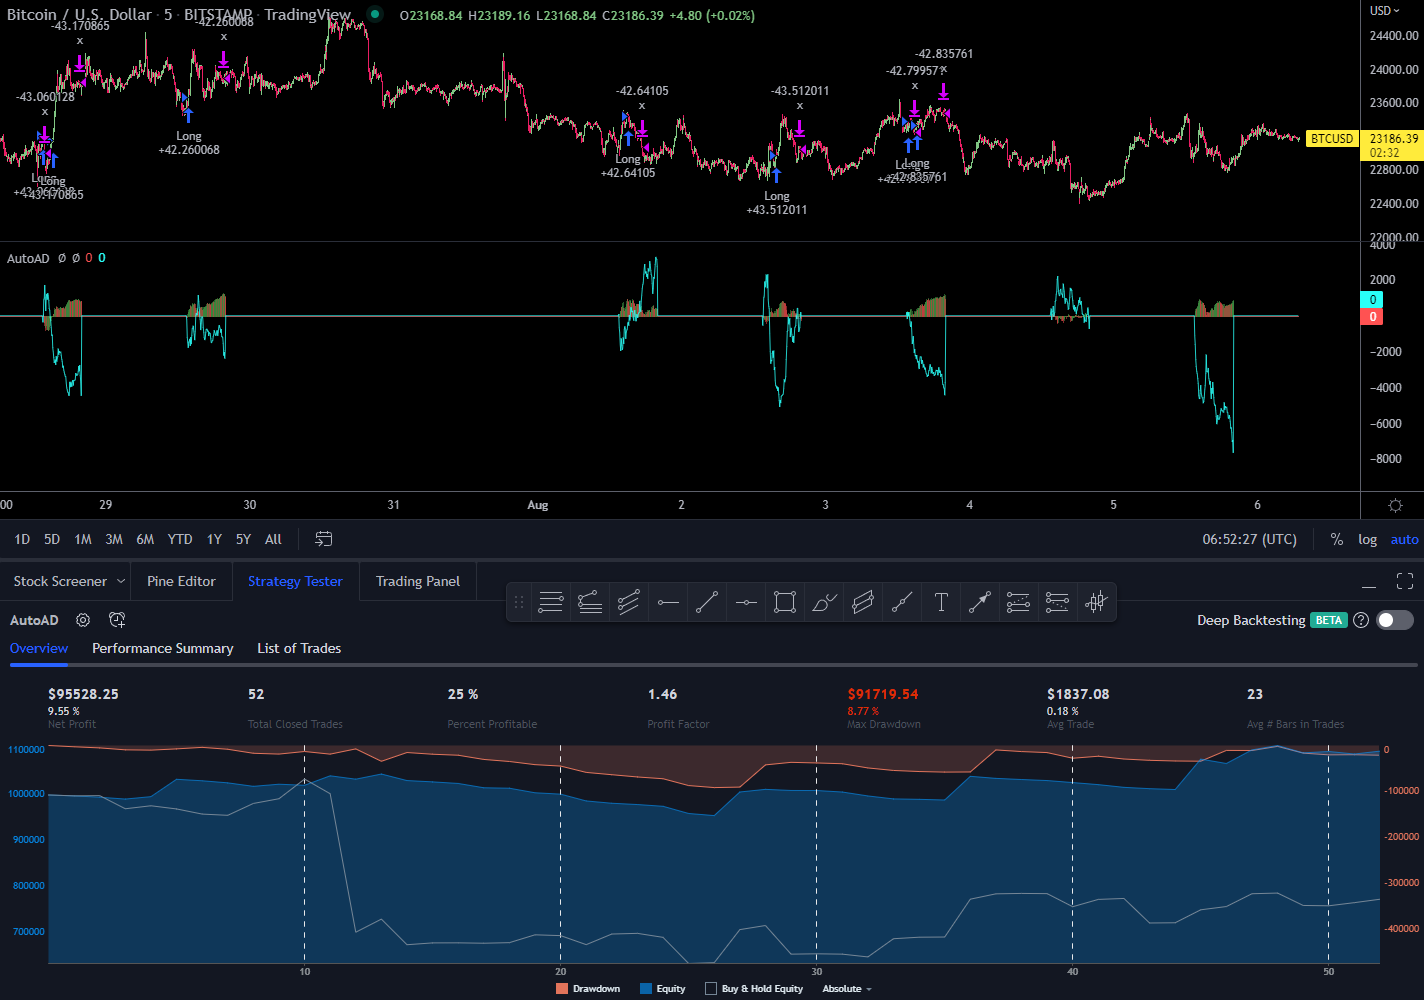
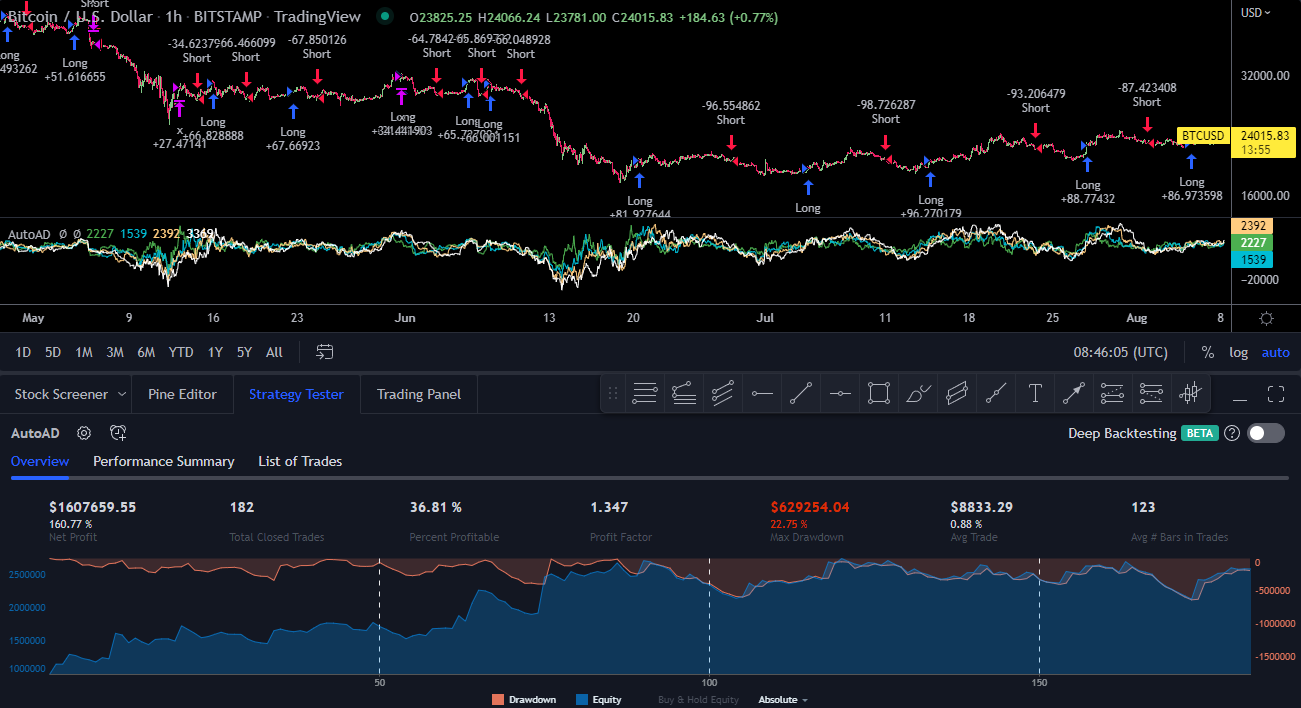
In the example below, the symbol of the chart is BTCUSD. Because the strategy will exit any trade before the US market close, this will only trade during the US stock market’s cash session.
6. The American Lunchtime Permabear
In this simple strategy, a wild man with a hunch that the market will crash any day now shorts the market at the same time each day during his admirably long lunch break.
Short trades are entered at 10:45 and closed at 13:00.
The only trade condition which this strategy uses is that TICK must be below an impossibly high number to enter into a trade. All of the other conditions come from the time restrictions placed on the strategy in the primary trade conditions at the top of the settings menu. All other conditions are disabled. No groups or ADs are used.
The irrelevant plots have been disabled. As you can hopefully see, the indicator doesn’t show anything. What’s there to show?

DOGEUSD:
NKLA:
XAUUSD:
KDP:
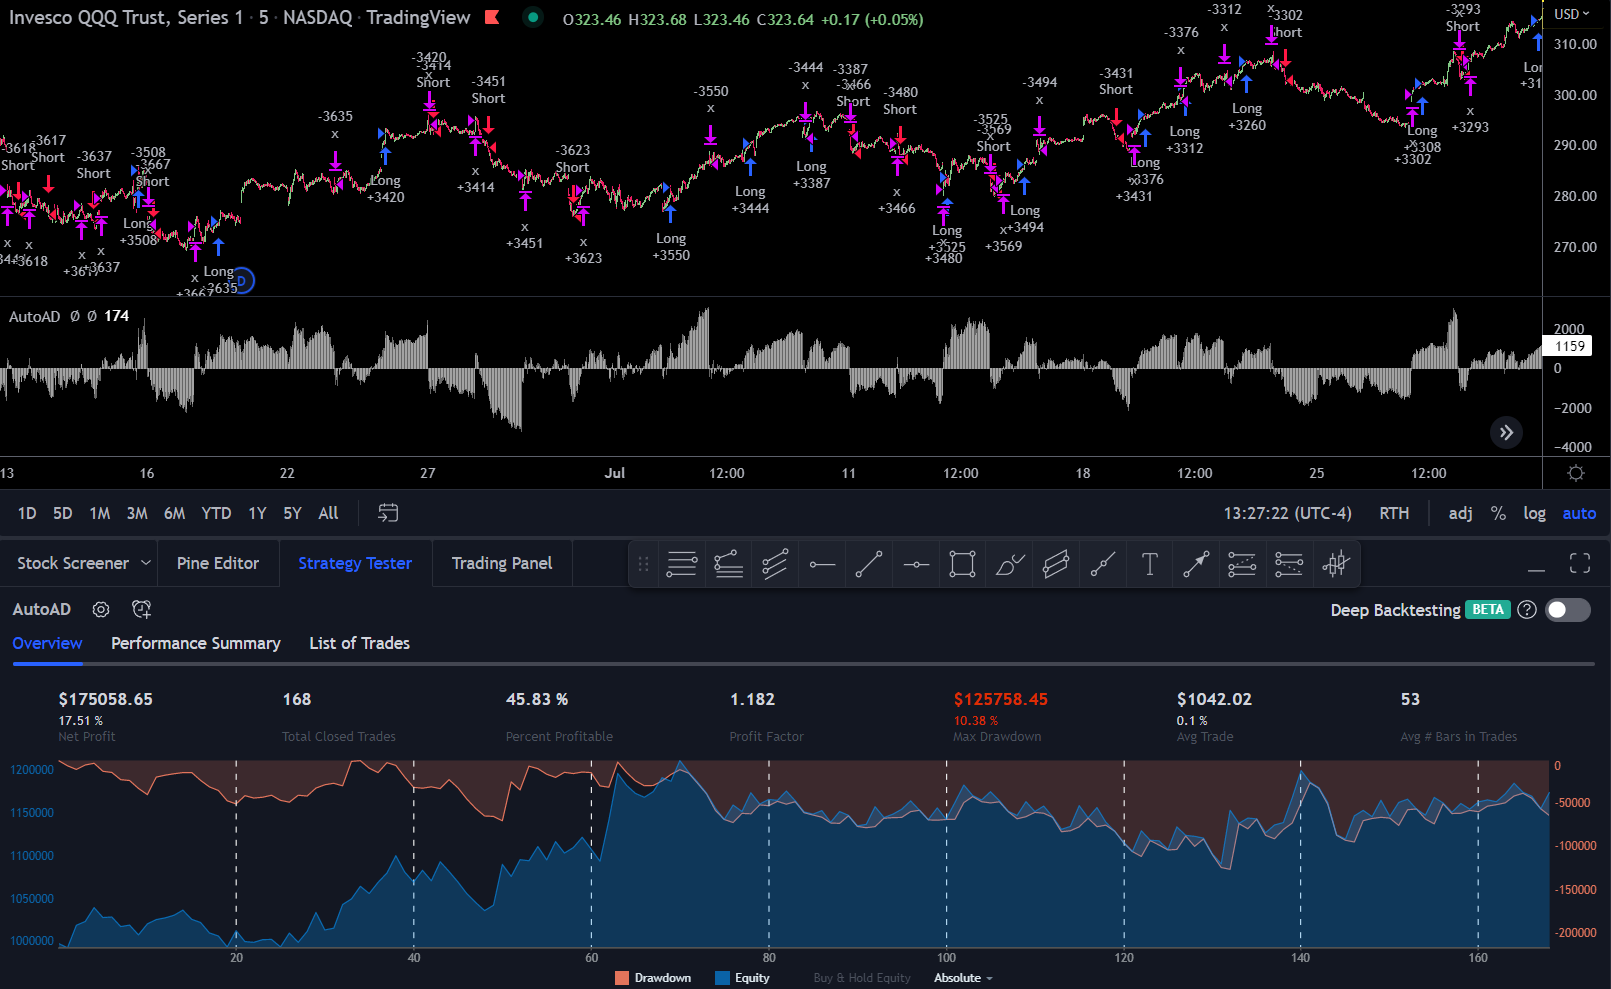
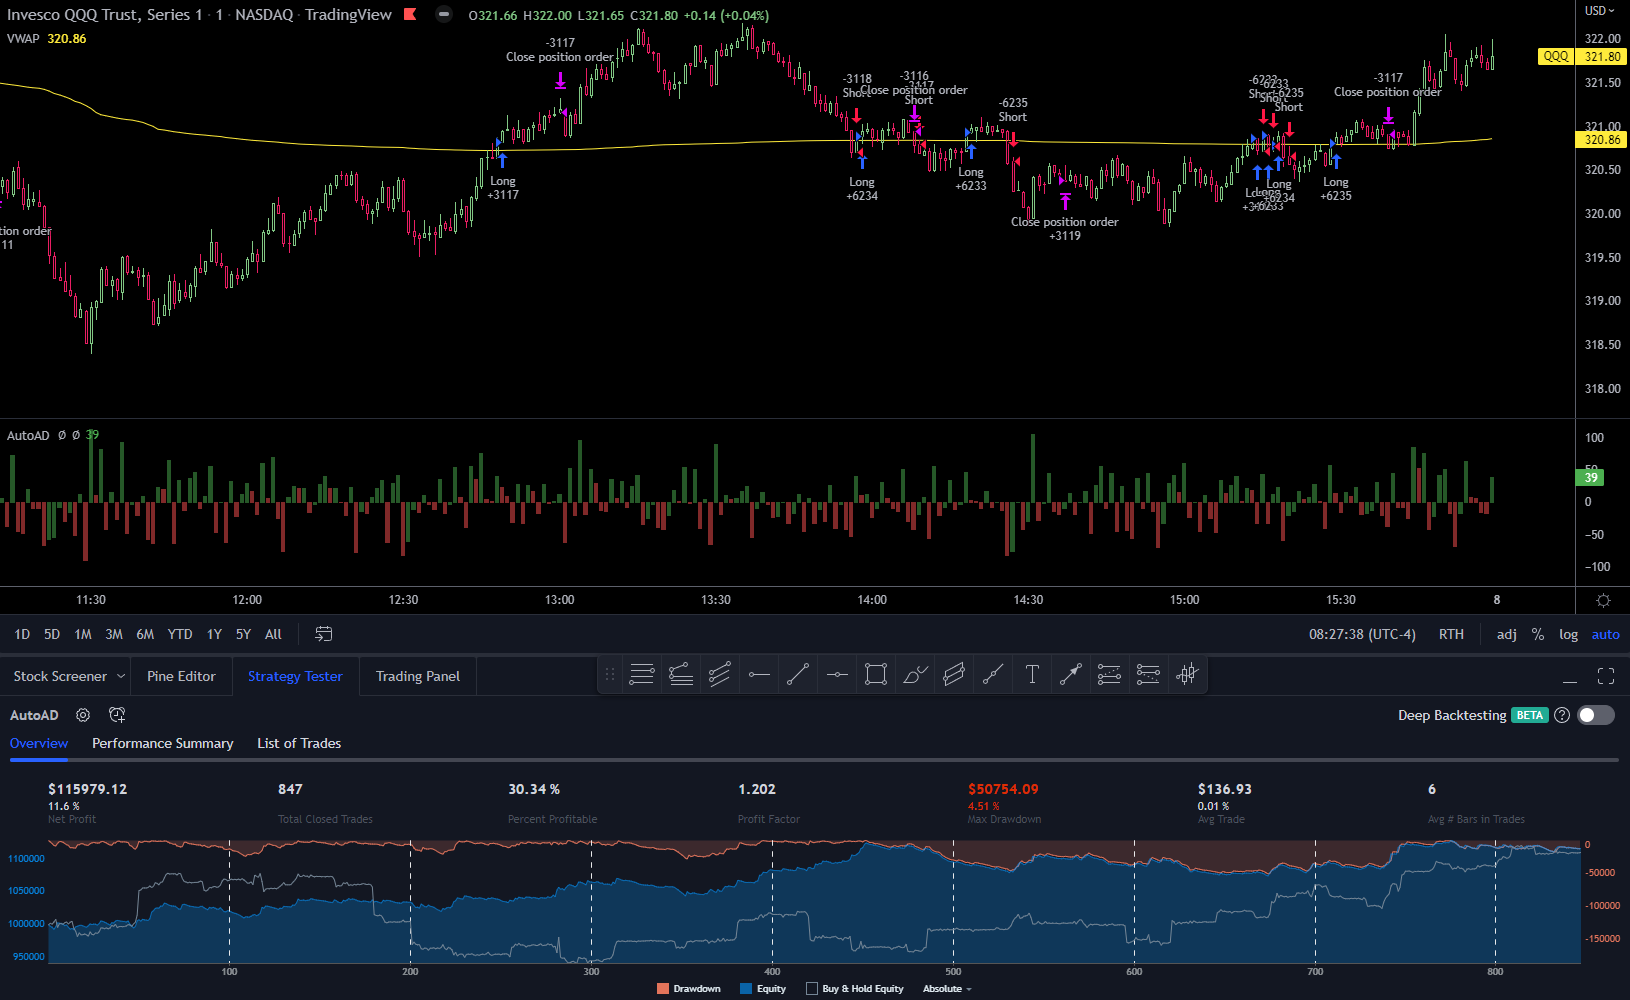
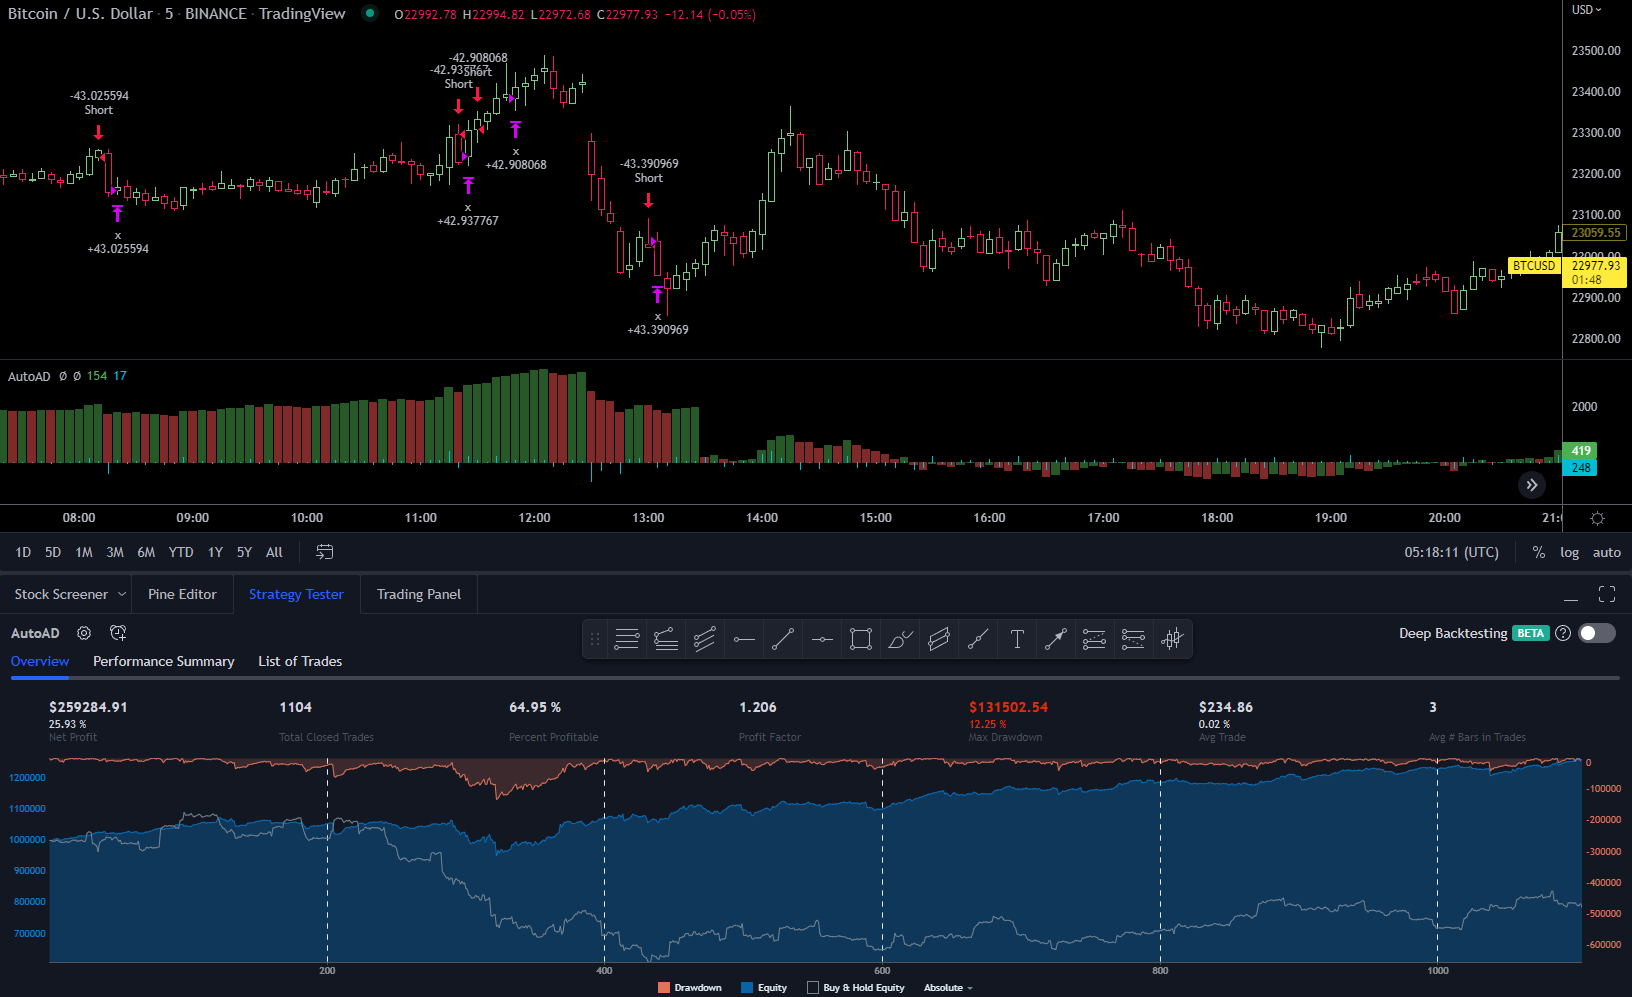
7. NDX VWAP Scalper
This strategy uses the Weighted NDX AD for it’s entries and will close 10 candlesticks after the most recent entry. In these examples it will be ran on the 1m timeframe over the last three months or so. Because it’s using the NDX preset, it’s suggested to apply this strategy to constituents of the NDX or assets which are highly correlated with the NDX.
Because the VWAP which is referenced in trade conditions will always be from the previous candlestick, the first candlestick of the day will reference the last candlestick of the previous day. For that reason, the first candlestick of the day is excluded from the trade conditions by using the 1 minute timeframe and restricting entry trades until 09:31. VWAP has been added to the example chart as a separate indicator for visual clarity.
The strategy will go both long and short. It will exit trades 15 minutes before the close.
Because the Weighted AD Type is ‘NDX AD’, group 1 is set to the top 38 NDX stocks. AD 1 is set to group 1, weighted and non-cumulative.
The entry conditions for long trades are:
AD 1 (Weighted non-cumulative NDX AD) must be positive
The low of the most recent candlestick must be below the VWAP
The close of the most recent candlestick must be above the VWAP
The entry conditions for short trades are:
AD 1 must be negative
The high of the most recent candlestick must be above the VWAP
The close of hte most recent candlestick must be below the VWAP
The closing trade conditions are:
10 candlesticks have passed since the last trade was entered
or
The time is 15:45
TSLA:
GOOGL:
ADBE:
SQ:
SHOP:
COIN:
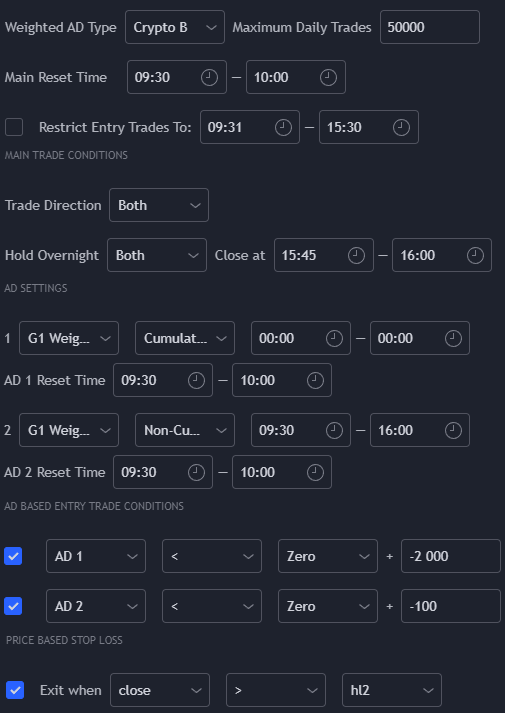
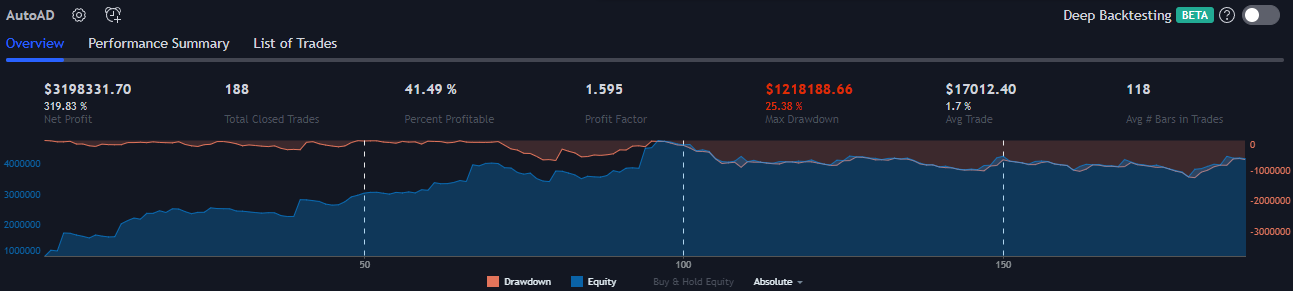
8. Crypto Mean Reverting Scalper
This strategy uses the Crypto B preset and is designed for scalping cryptocurrencies. Due to the very high frequency of trades this strategy makes, this may not be useful on many crypto exchanges with high fees or on cryptos with high slippage. One workaround for this is to apply it to a higher timeframe.
The strategy will trade both long and short with no entry time restrictions. Because Crypto Preset B has been used, only group 1 will be used. Note that AD 1 is cumulative and the session period is set to 00:00-00:00. This means that the accumulation will occur 24/7. This is an essential step for accumulating data 24/7 when trading cryptocurrencies. The accumulation will reset at the stock market’s cash open, at 09:30. You may prefer to reset the clock at midnight instead.
The long entry trade conditions are:
AD 1 (Weighted Crypto AD Preset B, cumulative) must be below -2000 (-2%)
AD 2 (Weighted Crypto AD Preset B, non-cumulative) must be below -100 (-0.1%) - this means that on the most recent candlestick, AD 2 should be down at least 0.1%
The long closing trade condition is that the close must be above the midpoint of the most recent candlestick (high + low)/2. This basically means that the strategy will close on the next 1 candlestick bounce.
The short entry trade conditions are:
AD 1 (cumulative) must be above 2000 (2%)
AD 2 (non-cumulative) must be above 100 (0.1%)
The short closing trade condition is that the close must be below the midpoint of the most recent candlestick.
Short term scalping on short timeframes can be alluring, but it comes with important considerations, especially with this strategy’s stop loss condition:
Comissions and slippage
Gaps on small timeframes. A rule of thumb when trading is, if you see loads of gaps (and you’re not on a time sessioned daily chart), use a higher timeframe. In this strategy, the same rule applies. We’re using (high-low)/2 which assumes that the high and the low actually represent the high and low of that unit of time. If you’re seeing gaps in chart, then the highs and lows aren’t truly representing what that unit of time should be for our needs.
This strategy uses the fixed nominal 0.1% per candlestick for it’s entries. A 1 minute timeframe is unlikely to produce many of those. A number like this should be suited to the timeframe the strategy is being applied to. A quantitative solution to this problem would be to use ATR.
Unless you don’t pay any commisions and can somehow get around slippage, don’t bother trying to use this strategy on a 1m timeframe.
BTCUSD (binance’s data) on the 10m:
BTCUSD 15m:
BTCUSD 20m:
BTCUSD 30m:
This looks too good, so let’s add in Binance’s 0.1% commission: (Notice that the average trade above only makes 0.06%!)
Not all hope is lost however, as Binance does offer commission free spot trading for the following pairs; BTC/AUD, BTC/BIDR, BTC/BRL, BTC/BUSD, BTC/EUR, BTC/GBP, BTC/RUB, BTC/TRY, BTC/TUSD, BTC/UAH, BTC/USDC, BTC/USDP and BTC/USDT. These will come with their own considerations. Also note that you can’t use margin when spot trading, so no shorts allowed!
9. Rolling Trend Follower with ATR Trailing Stop Loss
This strategy uses all four rolling settings for entries and uses a wide ATR trailing stop loss in an attempt to stop major drawdowns.
The entry trade conditions for long trades are:
The cumulative performance of the chosen Weighted AD Type over the last 24, 48, 72 and 96 hours must all be positive.
The close of the most recent candlestick must be below the open.
The entry trade conditions for short trades are:
The cumulative performance of the chosen Weighted AD Type over the last 24, 48, 72 and 96 hours must all be negative.
The close of the most recent candlestick must be above the open.
The closing trade condition is an ATR based trailing stop loss of 10 times the ATR of the previous 1000 candlesticks.
Notice the returns graph on these charts. The hourly backtest on crypto has included a hugely volatile market, which is where trend following algorithms do the best. While the crypto market has been going sideways, this strategy has not made any progress.
ETHUSD:

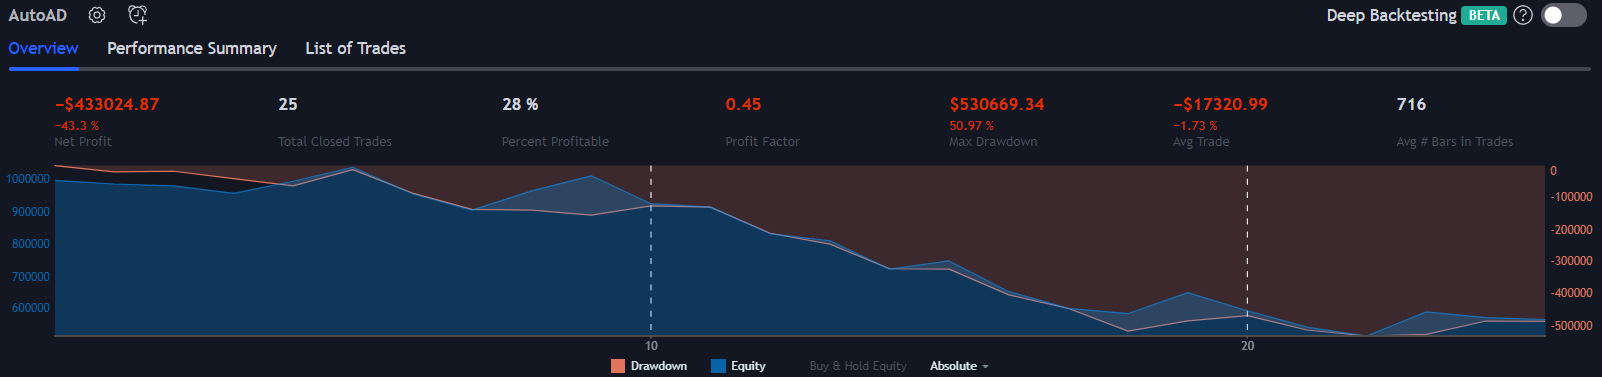
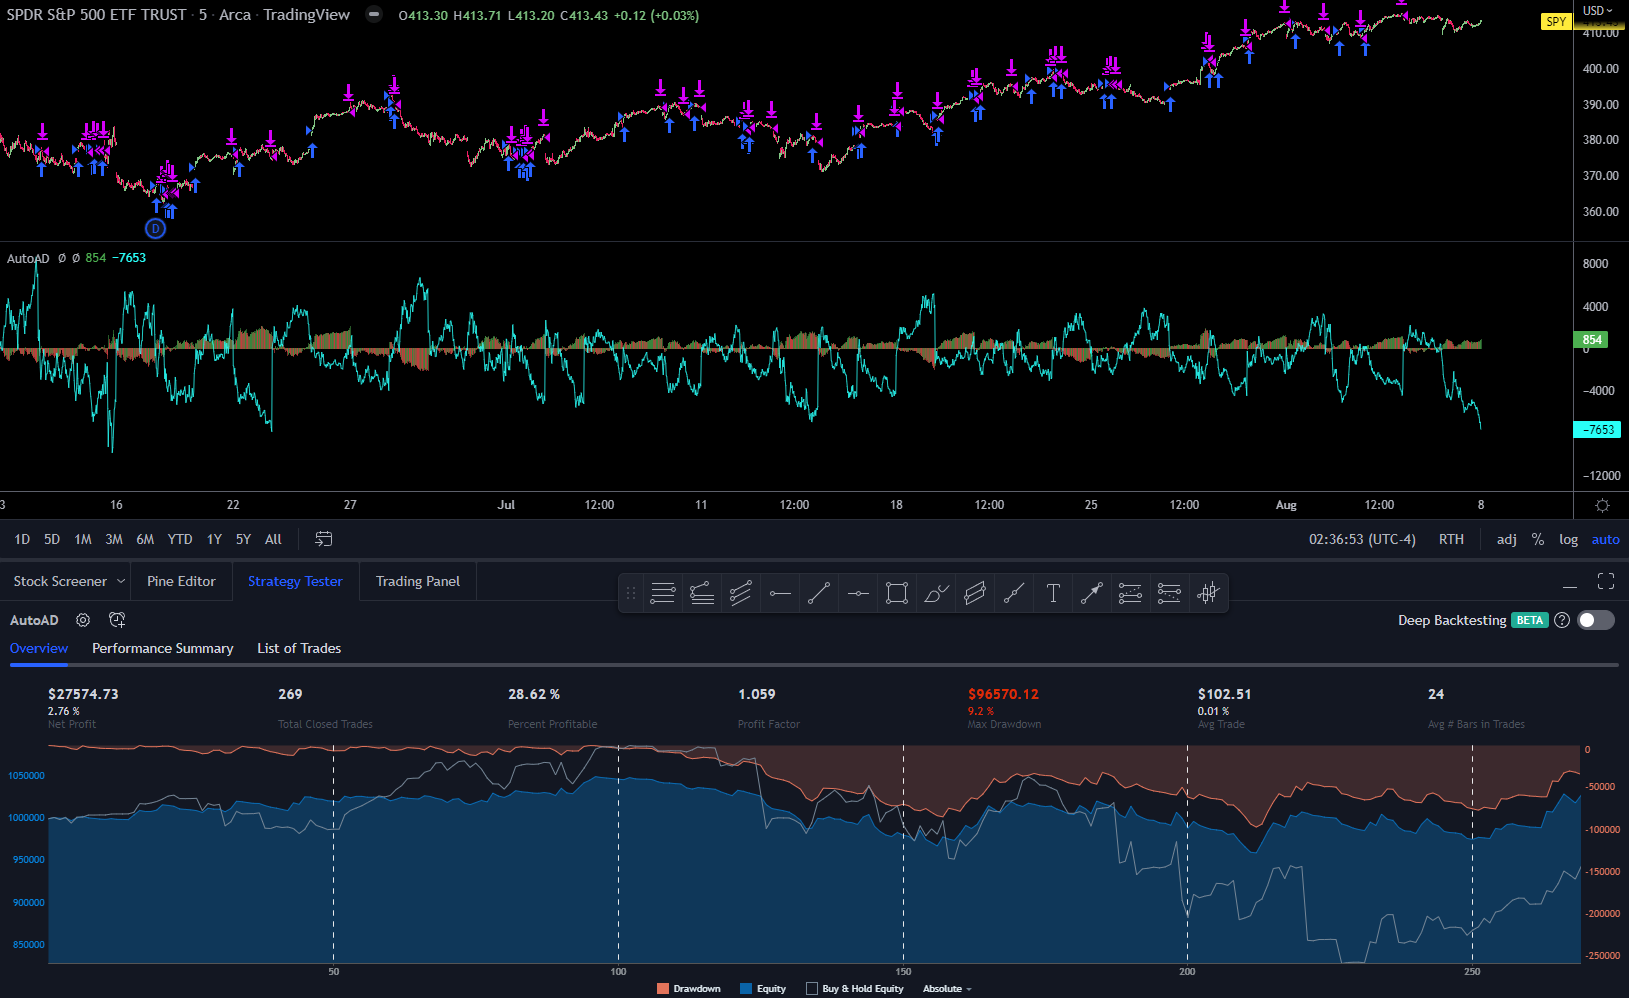
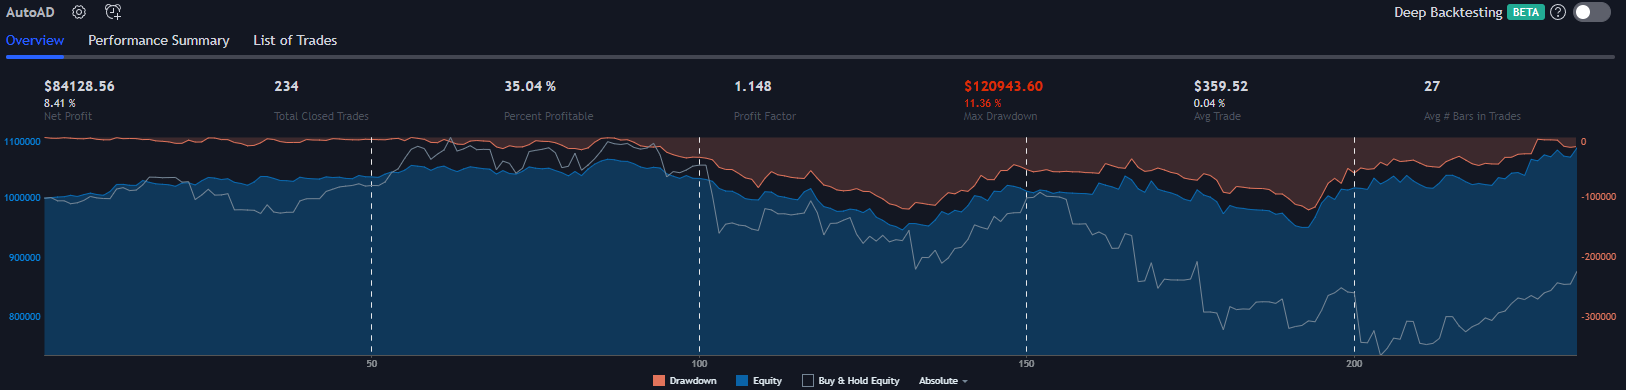
10. S&P and Volatility Divergence
This strategy uses the Weighted S&P AD with an equally weighted basket of volatility products combined into another AD.
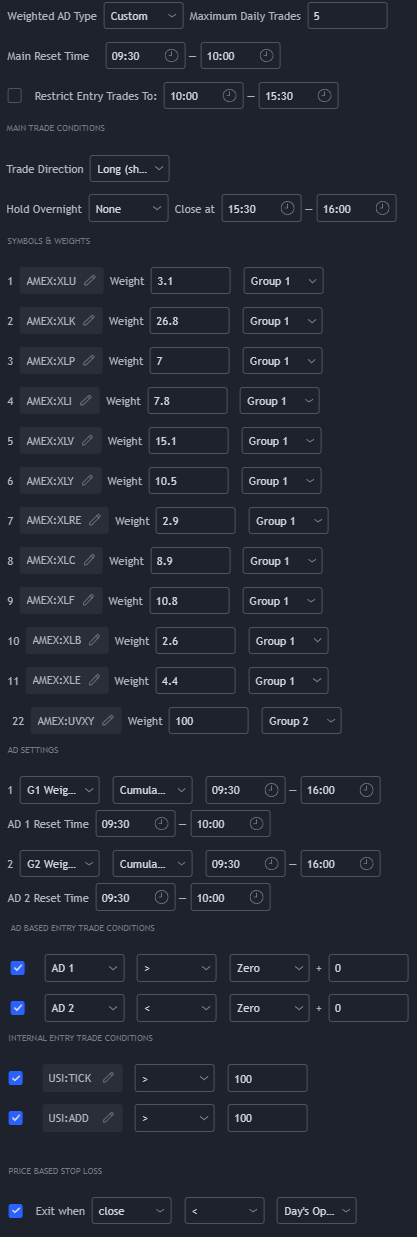
Most of the settings used are default. Group 1 and AD 1 are assigned to the S&P subsectors. Group 2 and AD 2 are assigned to the volatility products as shown in the settings on the right.
The theory behind this strategy is that S&P volatility products and the S&P should generally be inverse, so when they’re not, there may be a tradable divergence. For this strategy, both the S&P AD (group 1) and the volatility AD (group 2) must be negative (for long trades) or positive (for short trades).
The stop loss condition used here is that, for longs, the close of the most recent candlestick must be below the previous day’s open. For shorts, the close of the most recent candlestick must be above the previous day’s open. This results in a trailing stop loss.

QQQ:
TSLA:
META:
AMZN:
NVDA: